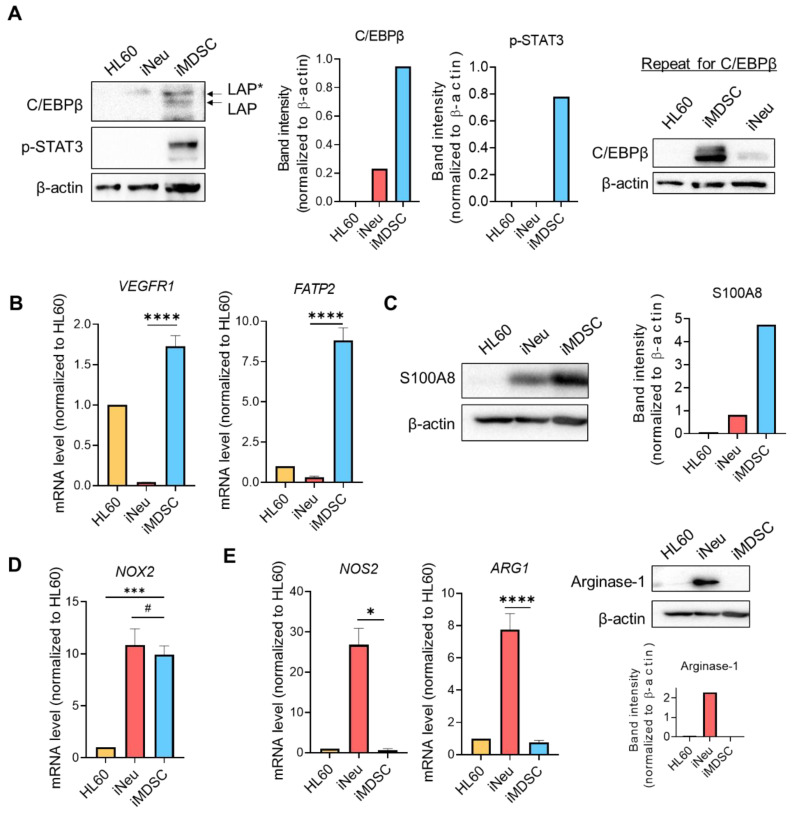
Figure 4.
iMDSC selectively upregulate the expression of MDSC functional players. (A) Protein levels of C/EBPβ and phospho-STAT3 (Tyr705) in HL60, iNeu and iMDSC, detected by Western blot. The normalized band intensity was shown. Shown on the right is the repeat experiment for C/EBPβ with independently extracted cell lysates. (B) Expression of VEGFR1 and FATP2 (measured by qRT-PCR) in HL60, iNeu and iMDSC. Relative mRNA was normalized to GAPDH (internal control) and HL60 (the reference baseline of 1.0). (C) Protein level of S100A8 in HL60, iNeu and iMDSC, detected by Western blot. The normalized band intensity was shown. (D) Expression of NOX2 (measured by qRT-PCR) in HL60, iNeu and iMDSC. Relative mRNA was normalized to GAPDH (internal control) and HL60 (the reference baseline of 1.0). (E) Expression of NOS2 and ARG1 at the mRNA level measured by qRT-PCR, and Arginase-1 at the protein level detected by Western blot in HL60, iNeu and iMDSC. In (B,D,E), # p > 0.05, * p < 0.05, *** p < 0.001, **** p < 0.0001, two-tailed Student’s t-test. For (D), one-way ANOVA followed by multiple comparisons returned equivalent significance levels.

