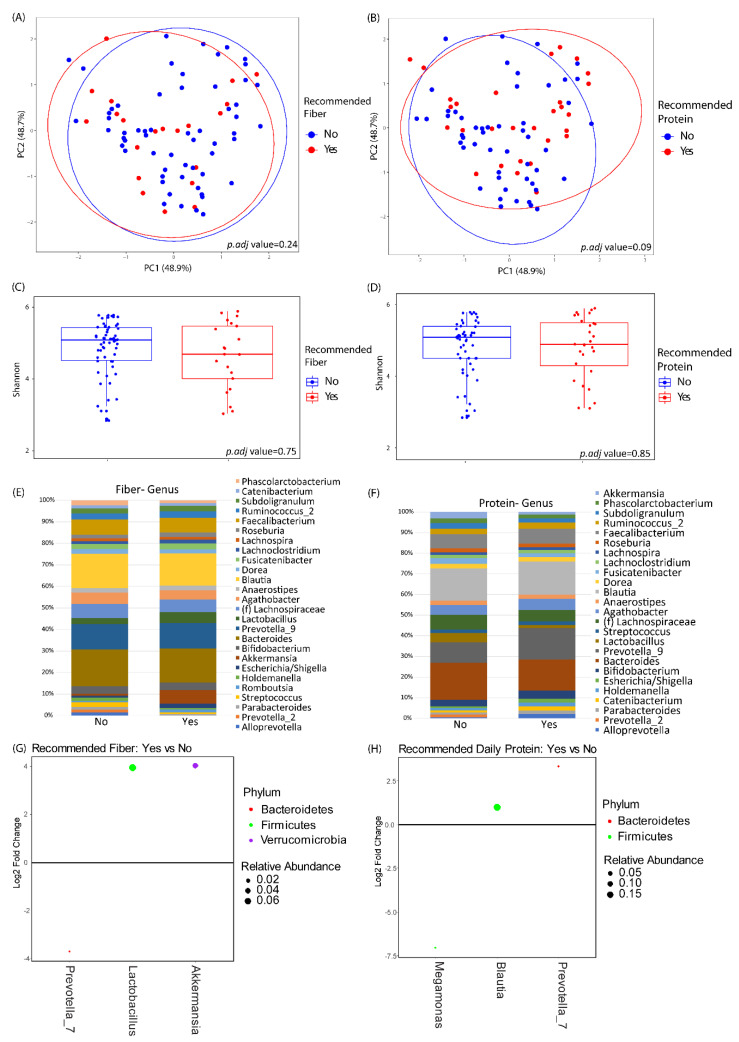
Figure 2.
Baseline microbiome differences by protein and fiber intake. (A,B) Principal coordinates analysis plots of microbial community makeup by (A) recommended fiber intake and (B) recommended protein intake. (C,D) Shannon index of microbial diversity by (C) recommended fiber intake and (D) recommended protein intake. (E,F) Taxonomic summary plots by (E) recommended fiber intake and (F) recommended protein intake. Only genera with ≥1% relative abundance are shown. (G,H) Differentially abundant genera by DESeq2 analysis between subjects at baseline stratified by (G) recommended fiber intake or (H) recommended protein intake. Genera that are above 0 represent genera that have a higher abundance in patients who are taking in the recommended amount of fiber or protein as compared to those that are not. Dots are colored by phylum and sized by mean relative abundance across all samples.

