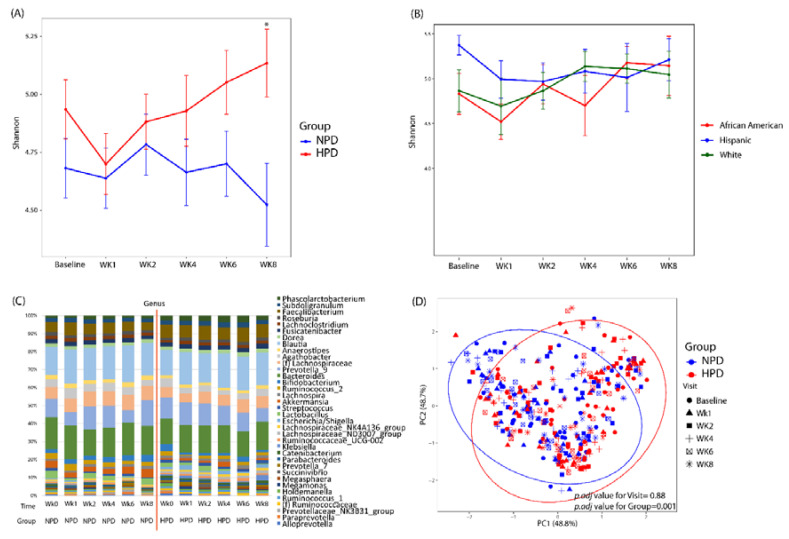
Figure 3.
High protein and calorie restriction effects on microbial diversity and composition. (A) Shannon index across study visits and by intervention group. (B) Shannon index for the HPD group divided by race/ethnicity. (C) Taxonomic summary plots of genera by study visit and by group. Only genera with a relative abundance ≥1% are shown. (D) Principal coordinates analysis of microbial commnuity composition colored by group with shapes representing study visit. NPD: Normal protein diet. HPD: High protein diet. Wk: Week. * Denotes p-value < 0.05 between the two arms.

