
Figure 8.
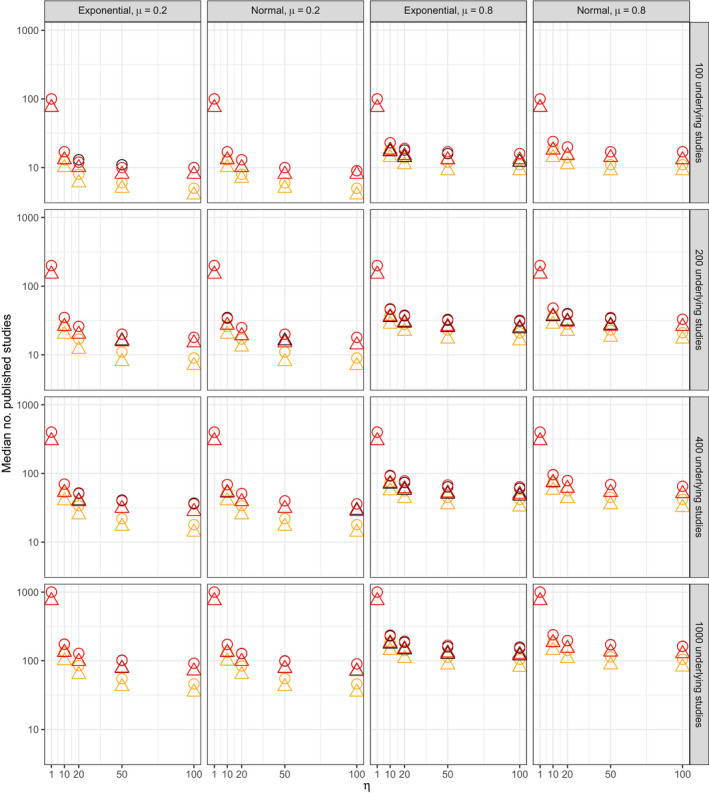
Median number of published studies across all simulation iterates (rows, numbers of studies in the underlying population before publication bias (5M
*); columns, distributions of study level random effects and true mean μ):  , not selected on standard error;
  , selected for small standard error;
  , common effect;
  , robust clustered;
  , robust independent