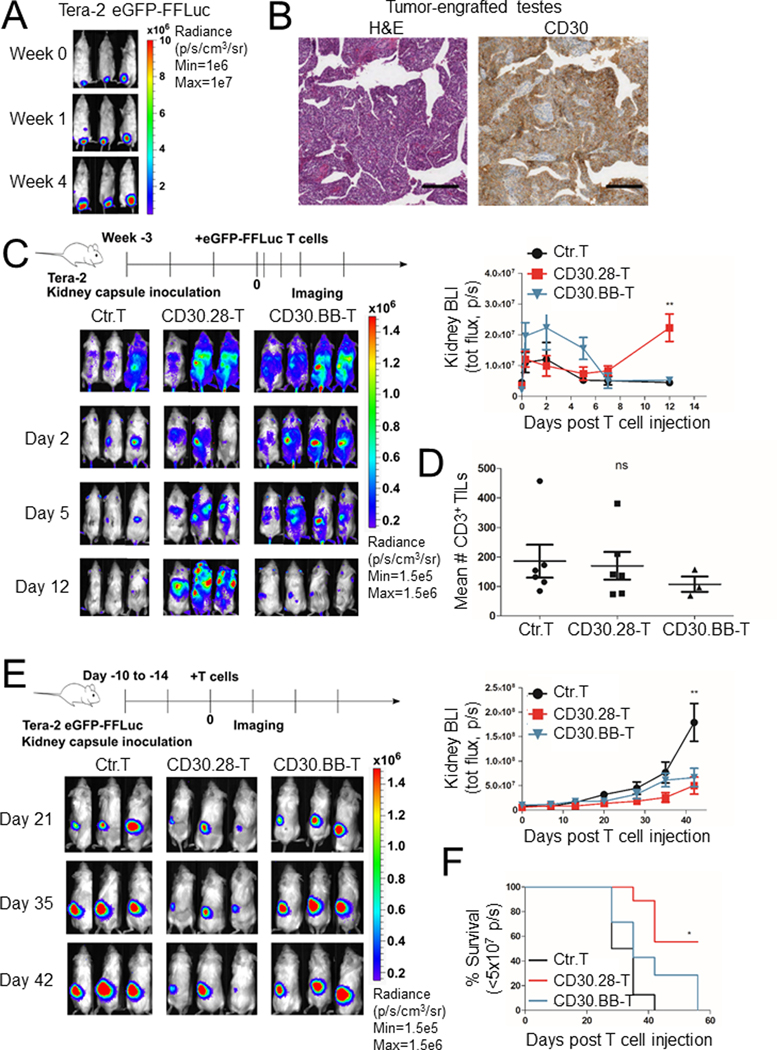
Figure 4. CD30.CAR T cells localize to EC tumors and exhibit antitumor activity in vivo.
(A) Representative in vivo IVIS imaging of NSG mice inoculated with 2 × 10⁶ Tera-2 cells labeled with eGFP-FFLuc into the left testis. (B) Representative hematoxylin/eosin (H&E) and human CD30 IHC staining of EC tumors growing in the testis are shown at 4X magnification, scale bar=250 μm. (C) NSG mice were inoculated with Tera-2 cells under the left kidney capsule and, 21 days later, infused i.v. with 1 × 10⁷ eGFP-FFLuc-labeled CD30.CAR T cells or CD19.CAR T cells (irrelevant T cells). Representative IVIS images indicating CAR T-cell localization and expansion (left panel) and cumulative BLI (right panel) are shown (mean ± SEM, n=3–4 per group, 2 independent experiments). **=p<0.001, one-way ANOVA at day 12. (D) T-cell treated mice were sacrificed at day 30–45 post tumor inoculation and tumors were stained with anti-human CD3 to detect tumor-infiltrating T lymphocytes. CD3+ T cells were counted at 400x magnification with the tumor covering at least 80% of the field of view in a blinded fashion. Cumulative quantification of CD3+ T-cell counts are shown (mean ± SEM, n=1–3 per group, 4 independent experiments). ns=not significant, one-way ANOVA. (E) NSG mice were inoculated with Tera-2 cells labeled with eGFP-FFLuc under the left kidney capsule and received 1 × 10⁷ CD30.CAR T cells or CD19.CAR T cells (Ctr.T) i.v. by day 15. Representative IVIS images indicating tumor growth (left panel) and cumulative BLI (right panel) are illustrated (mean ± SEM, n = 4–5 per group, 2 independent experiments). **=p<0.001, one-way ANOVA at day 42. (F) Cumulative Kaplan-Meier survival curve of BLI <5 × 10⁷ p/s for 2 independent experiments. *=p<0.05 by log-rank (Mantel-Cox) test.

