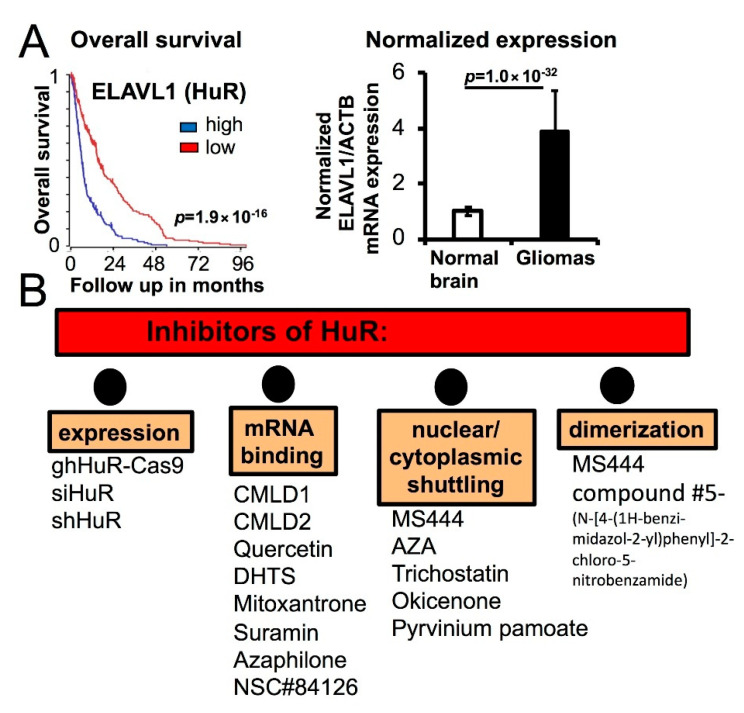
Figure 4.
Classes of the available HuR inhibitors. (A) Graph (left) illustrates the Kaplan–Meier overall survival curves for patients with gliomas harboring low (red, n = 245) or high (blue, n = 245) expression of the ELAVL1 transcript (Rembrandt, Madhavan, Mas 5.0-U132p2 study from R2: platform, median cut-off modus); the graph (right) illustrates normalized ELAVL1/ACTB expression in gliomas (n = 500) compared to normal brain (n = 44). Data are shown as mean ± SD. The following research studies from the R2: platform have been utilized for the analysis: Rembrandt, Madhavan, Mas 5.0-U132p2 study for gliomas and Harris, Mas 5.0-U132p2 study for normal brain. (B). Classes of the available HuR inhibitors.

