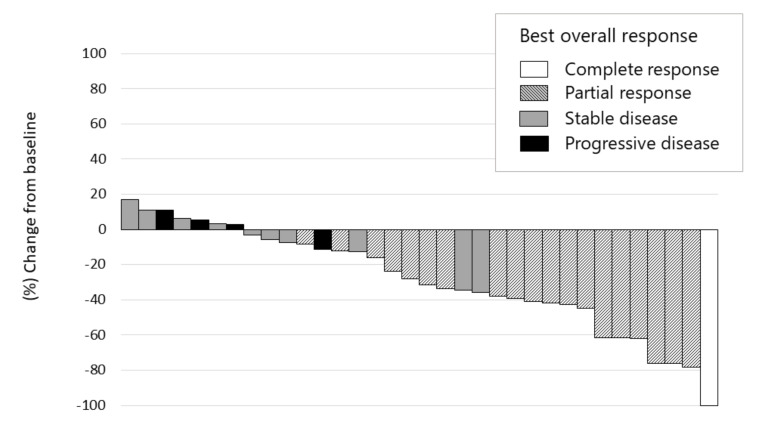
Figure 4.
Waterfall plot of maximum tumor response to lenvatinib therapy using mRECIST. Complete response, partial response, stable disease, and progressive disease were noted in 2.8% (n = 1), 52.8% (n = 19), 30.6% (n = 11), and 11.1% (n = 4), respectively. The objective response rate and disease control rate in patients who underwent radiological evaluation were 55.6% and 86.1%, respectively, as assessed using the mRECIST. The depth of response was −25.9% (IQR −43.0–−5.2) in all patients and −41.2% (IQR −61.8–−23.8) in responders.

