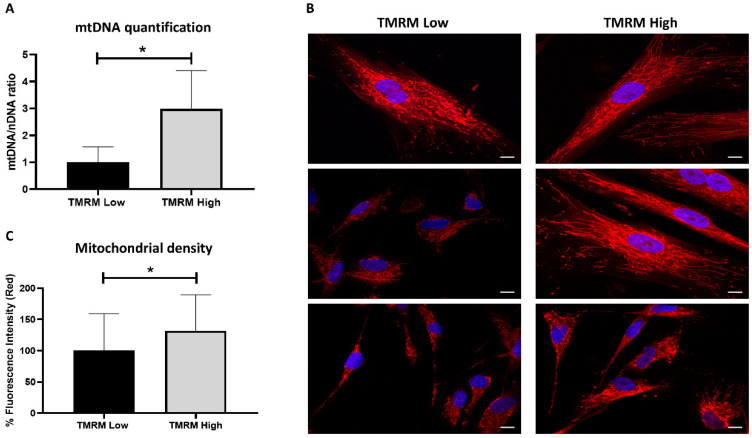
Figure 3.
Mitochondrial analysis in TMRM-low and high cells. (A) mtDNA content was calculated using quantitative real-time PCR by measuring the ratio of mitochondrially encoded NADH: ubiquinone oxidoreductase core subunit 5 (ND5, mitochondrial encoded gene) to β2-microglobulin (B2M, nuclear encoded gene) DNA levels. Data are represented as mean ± SD. n = 5 per group. Statistical differences were calculated significant as * p < 0.05, determined by Student’s t-test. (B) Representative confocal pictures of MitoTracker Red CMXRos/DAPI to visualize the mitochondrial network. Magnification 63x. Calibration bar 10 µm. (C) Percent red fluorescence intensity of MitoTracker staining was calculated using ImageJ software. Data are represented as mean ± SD. Statistical differences were calculated significant as * p < 0.05, determined by Student’s t-test.

