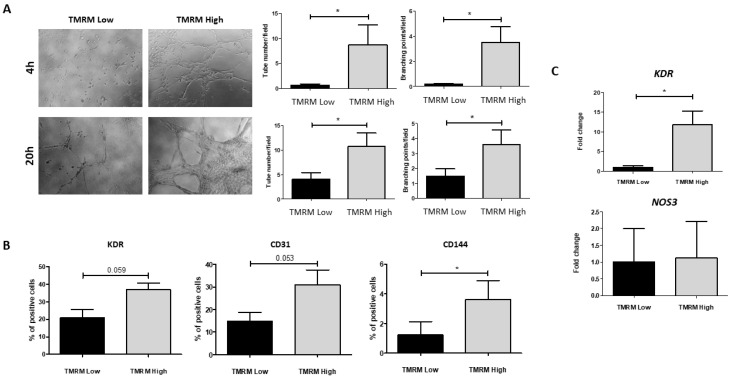
Figure 6.
In vitro endothelial differentiation in TMRM-low and high cells. (A) Cultrex assay: representative images of tubular-like structures formation in TMRM-low and TMRM-high cells on Cultrex membrane. The left panels show the quantification of tubular-like structures per microscopic field at 4 h and 20 h. The right panels show the number of branching points between tubular-like structures at 4 h and 20 h. In these conditions (n = 6); (B) FACS analysis: bar graphs show the expression of VEGFR-2/KDR, CD31, and vascular endothelial (VE)-cadherin/CD144 in TMRM-low and TMRM-high cells after culture into endothelial growing medium-2 (EGM-2) for 1 week. In these conditions (n = 3); (C) gene expression: bar graphs show the expression of VEGFR-2/KDR and NOS3 in TMRM-low, and TMRM-high cells after culture in EGM-2 for 1 week. Data are represented as mean ± SD of the fold change. Statistical differences were calculated significant as * p < 0.05, determined by Student’s t-test.

