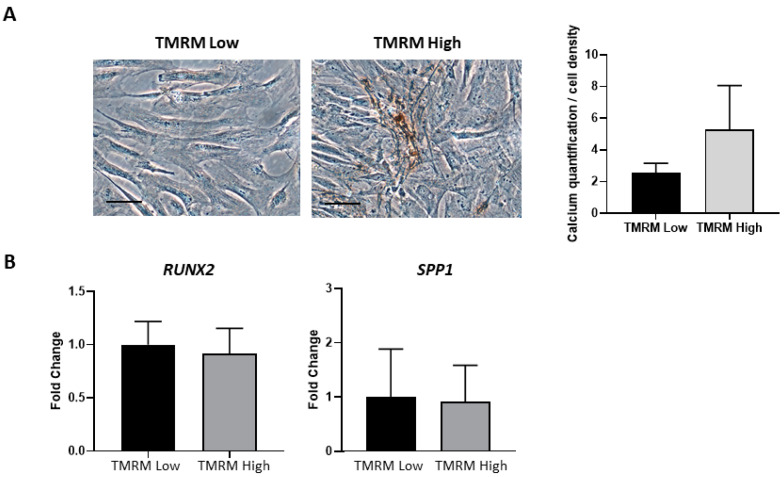
Figure 10.
In vitro osteogenic differentiation of TMRM-low and high cells. (A) The culture in pro-osteogenic conditions for 1 week enhance the expression of calcium salts, although not significantly (left panel). The bar graph shows the relative quantification (right panel). (B) Expression of genes involved in osteogenesis RUNX2: runt-related transcription factor 2, SPP1: secreted phosphoprotein 1. Data are represented as mean ± SD of the fold change. n = 3 per group. Statistical differences were determined by Student’s t-test.

