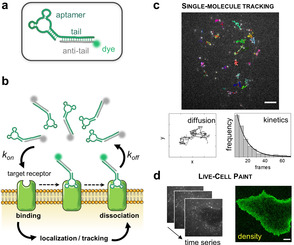
Figure 1.

a) The fluorescently conjugated aptamer probe. The aptamer tail (green) is annealed to its complementary anti‐tail (grey) bearing a fluorophore (green sphere). b) Schematic of live‐cell imaging using aptamers. Thanks to TIR illumination, only aptamers (green fluorophores) that bind cell‐surface receptors are selectively excited and detected. In contrast, freely diffusing aptamers (grey fluorophores) are not observed. Transient binding of aptamers to target receptors enables single‐molecule imaging on nearly unperturbed living cells. c) Single‐molecule tracking was performed using sub‐nanomolar concentrations of probes (0.05–0.20 nm) to study receptor diffusion and aptamer binding kinetics. Examples of single EGFR trajectories on the surface of an A431 cell are shown (top image). Scale bar: 5 μm. X‐Y coordinates of a representative trajectory are also displayed. Diffusive status of a receptor can be studied by analysis of thousands of trajectories. Additionally, aptamer binding kinetics can be assessed by analyzing the distribution of trajectory durations, which follows a single‐exponential decay (black line). d) Membrane receptor densities are obtained by live‐cell PAINT using low nm concentrations (1–20 nm). Time‐lapse sequences are recorded (on the left), then a PAINT image (on the right) is reconstructed. Scale bar: 5 μm.
