Figure 3.

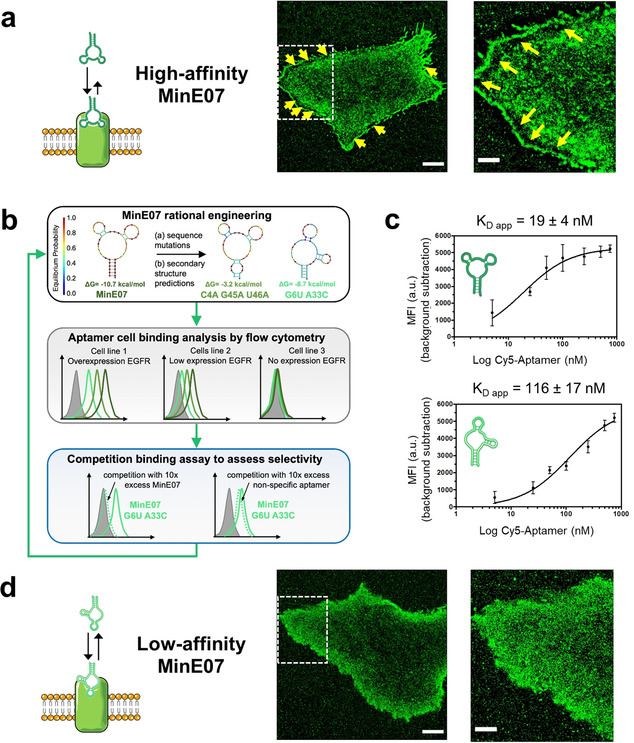
a) Reconstructed PAINT images of living A431 cells incubated with 3 nm MinE07 (high‐affinity MinE07). Scale bars: 5 μm (left) and 2 μm (right). Yellow arrows indicate aberrant irregular distribution of PAINT localizations at the edges of the cell. The image on the right shows a zoomed‐in view of the area within the dashed square. b) Workflow for aptamer engineering . Variant sequences were designed to destabilize the minimum free energy (MFE) secondary structure of MinE07 (top panel) and/or to promote alternative conformations, as shown for the MFE structure exhibited by MinE07_G6U/A33C (top panel, see also Figure S3). For each MinE07 variant, flow cytometry was used to assess binding of three cell lines that display differential expression of EGFR. Results and experimental details are reported in Figure S4‐S6. To assess retention of selectivity, candidate sequences were further tested in competition binding assays (Figure S7). c) Apparent dissociation constants (K D app) on HeLa cells were determined by flow cytometry using increasing concentrations of Cy5‐labeled anti‐EGFR aptamers (MinE07 and MinE07_G6U/A33C). Plots of median fluorescence intensity (MFI) versus aptamer concentration and apparent K D values are shown for MinE07 (top) and MinE07_G6U/A33C (bottom). Representative flow cytometry curves for all aptamer samples are shown in Figure S8. d) Reconstructed PAINT images of living A431 cells incubated with 3 nm MinE07_G6U/A33C (low‐affinity MinE07). Scale bars: 5 μm (left) and 2 μm (right). The image on the right shows a zoomed‐in view of the area within the dashed square.
