Figure 5.

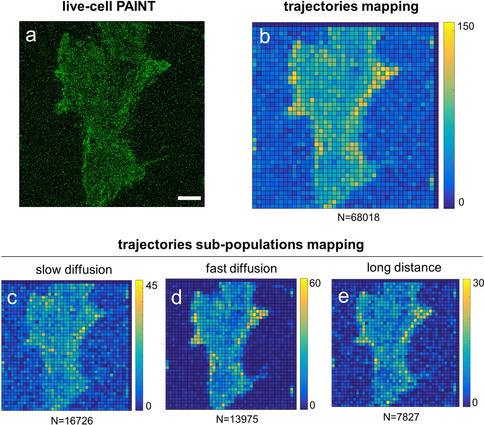
a,b) Reconstructed PAINT image (a), and density map of trajectories (>5 frames) detected by SMT (b) obtained upon incubation of living MDA‐MB‐231 cells with low‐affinity MinE07 aptamer (17 nm). Scale bars: 5 μm. c–e) Density maps of sub‐populations of trajectories were obtained after applying a filtering process (to the same field of view shown in a–c) to select molecules with (c) slow diffusion (2×10⁻³ μm2 s−1<D<2×10⁻² μm2 s−1), (d) fast diffusion (10−1 μm2 s−1<D<1 μm2 s−1), or (e) long distance covered (1.3 μm<d<1.7 μm). Colors indicate the number of trajectories centered within each pixel of the map (size 1 μm). The color scale is reported on the bar on the right of each image, while the total number of trajectories in the map is at the bottom.
