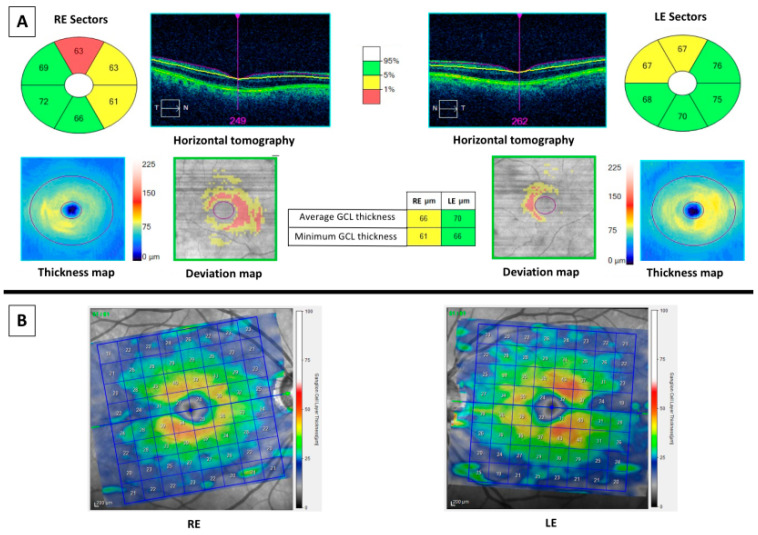
Figure 4.
OCT results of a 67 years-old male MCI patient. At left: images of the right eye (RE). At right: images of the left eye (LE). (A) Cirrus optical coherence tomography (OCT) results. Top middle (horizontal tomography): images of horizontal scans to confirm correct segmentation of ganglion cell-inner plexiform layer (GCIPL). Six sectors color values: sectors of GCIPL compared with normative database. Three and two sectors were thinner than fifth percentile in RE and LE, respectively. The thickness map shows the thickness in a color map (the caption of the colors is at right of the map), whereas the deviation map shows yellow or red color if a pixel of GCIPL is low of fifth or first percentile, respectively. Middle columns showed the average and the minimum values of GCIPL of both eyes, colored with yellow for the RE as they are thinner than fifth percentile. (B) Spectralis OCT showed a color map (the caption of the colors is at right of the maps) and values of thicknesses (in microns) of GCL. Comparing with Figure 3B, where a red ring could be appreciated, the RE of this patient is not red colored and LE is little red colored.

