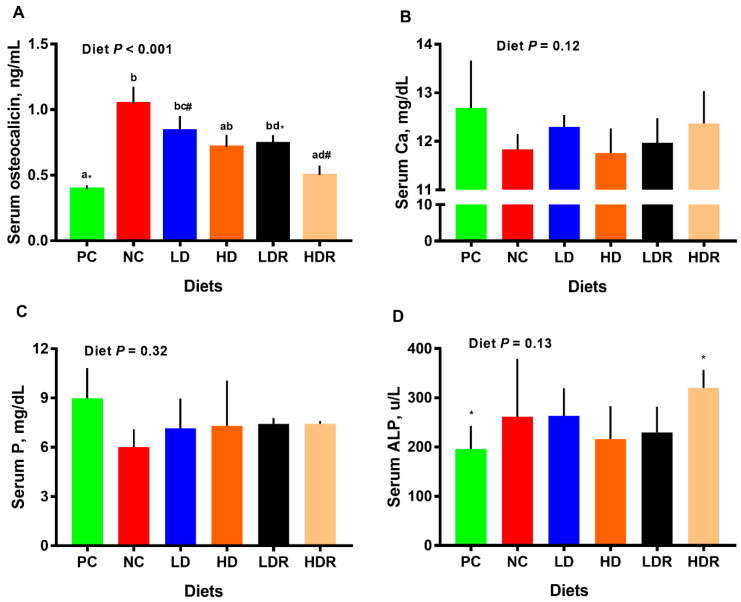
Figure 2.
Serum metabolites and hormones in pigs fed with low-protein diets supplemented with a corn-expressed phytase. (A) serum osteocalcin, (B) serum calcium (Ca), (C) serum phosphorus (P), (D) serum alkaline phosphatase (ALP). Pigs are grouped based on their dietary treatments: PC (positive control): normal protein, adequate Ca and available phosphorous (aP), no corn-expressed phytase (CEP) added; NC (negative control): low protein, adequate Ca and aP, no CEP added; LD: NC + CEP added at low dose, i.e., 2000 FTU/kg of diet; HD: NC + CEP added at high dose, i.e., 4000 FTU/kg of diet; LDR: LD with reduced calcium (Ca) and phosphorus (P); HDR: HD with reduced Ca and P. The values are means ± standard errors of means. Different letters in the bar plots indicate significant differences (p ≤ 0.05, Tukey’s test) and common superscript symbols indicate a trend (0.05 < p ≤ 0.1). n = 7–8 for each dietary group.

