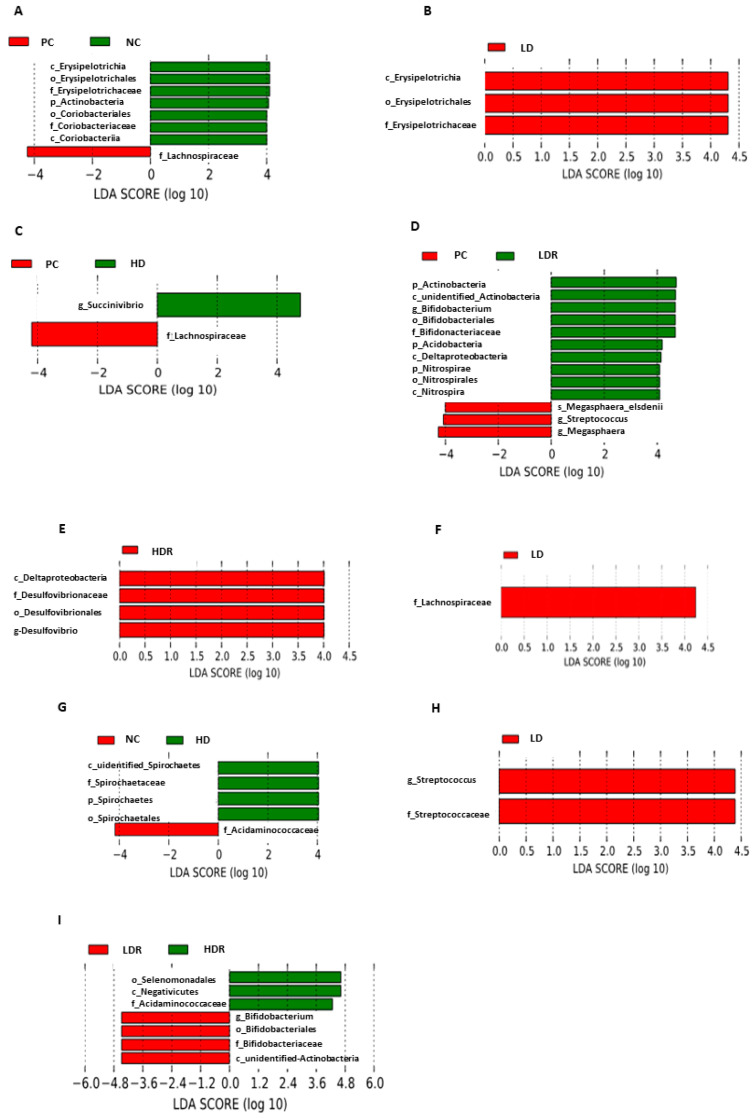
Figure 5.
Fecal microbiota composition histograms in pigs fed with low-protein diets supplemented with a corn-expressed phytase. Histograms of linear discriminant analysis (LDA) with effect size (LEfSe) on fecal microbiota composition (A) PC vs. NC, (B) PC vs. LD, (C) PC vs. HD, (D) PC vs. LDR, (E) PC vs. HDR, (F) NC vs. LD, (G) NC vs. HD, (H) LD vs. LDR, (I) LDR vs. HDR. Pigs are grouped based on their dietary treatments: PC (positive control): normal protein, adequate Ca and available phosphorous (aP), no corn-expressed phytase (CEP) added; NC (negative control): low protein, adequate Ca and aP, no CEP added; LD: NC + CEP added at low dose, i.e., 2000 FTU/kg of diet; HD: NC + CEP added at high dose, i.e., 4000 FTU/kg of diet; LDR: LD with reduced calcium (Ca) and phosphorus (P); HDR: HD with reduced Ca and P. There was no significant difference on species identified for LD vs. HD and HD vs. HDR. n = 6 for each dietary group.

