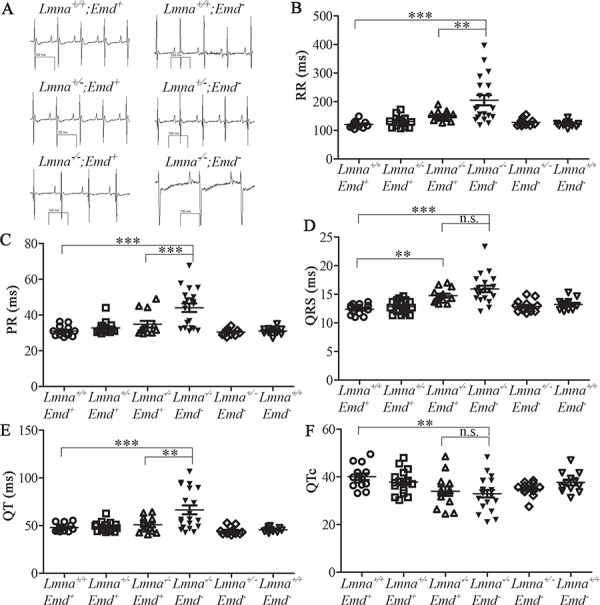
Figure 5.

Electrocardiographic analysis of 3-week-old mice with deletions of Lmna and Emd. (A) Representative electrocardiograms of mice with genotypes indicated. (B) RR interval for mice of genotypes indicated. (C) PR interval for mice of genotypes indicated. (D) QRS interval for mice of genotypes indicated. (E) QT interval of mice of genotypes indicated. (F) QTc for mice of genotypes indicated. (B), (C), (D), (E) and (F) show value for each individual mouse with means (longer horizontal lines) and standard errors (shorter horizontal lines). n.s.: not significant, **P < 0.01, ***P < 0.001.
