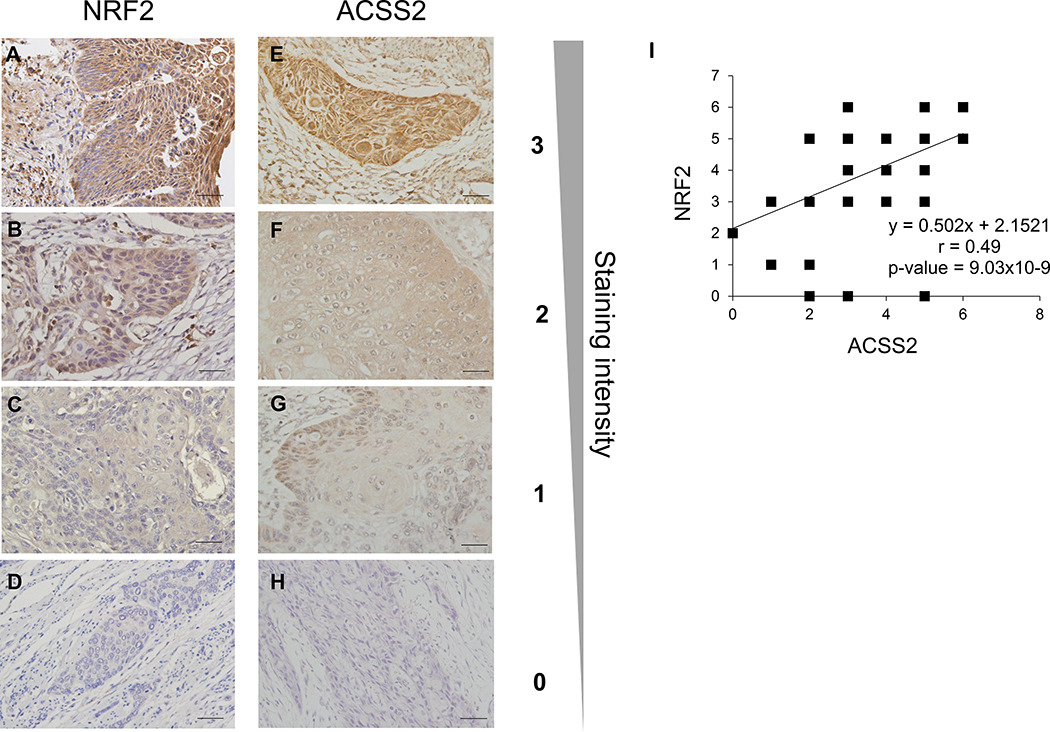
Figure 3. NRF2 and ACSS2 expression are positively correlated in human ESCC tissue samples.
. ESCC samples were categorized based on the staining intensity (Scale bar = 50 μm). Images in panel A-H came from different patients. (A) high NRF2 staining intensity; (B) moderate NRF2 staining intensity; (C) low NRF2 staining intensity; (D) no NRF2 staining; (E) high ACSS2 staining intensity; (F) moderate ACSS22 staining intensity; (G) low ACSS2 staining intensity; (H) no ACSS2 staining. (I) IHC of human samples revealed a significantly positive correlation between NRF2 and ACSS2 expression in these samples.

