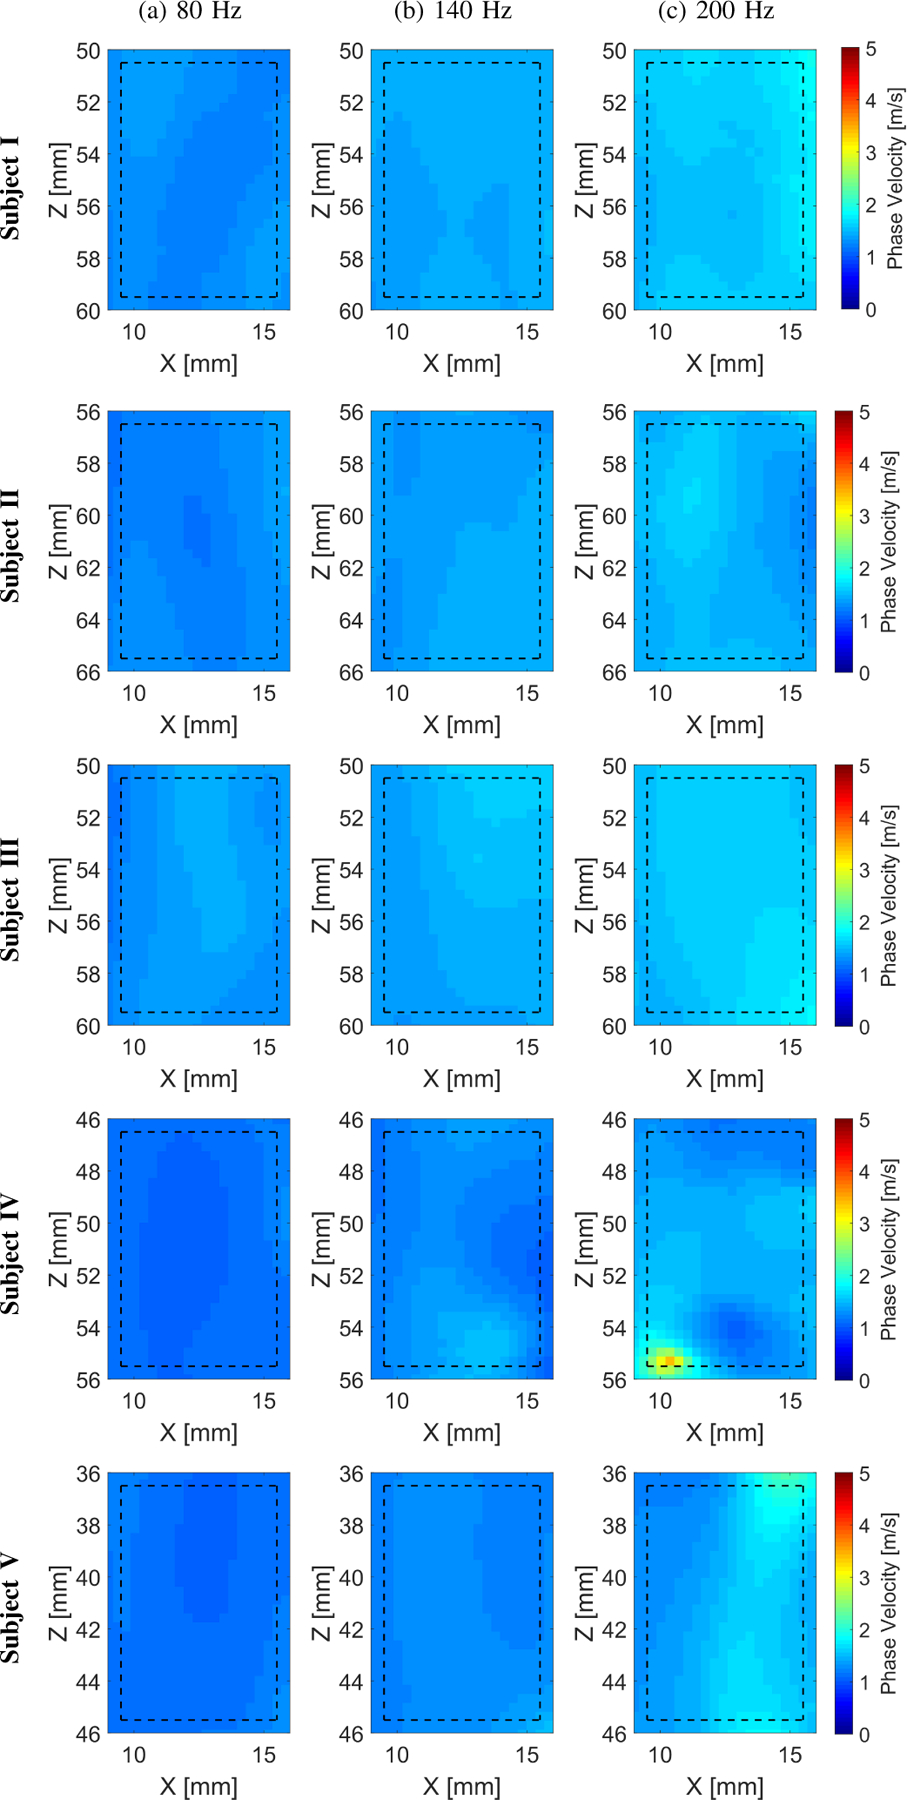
Fig. 12:

Two-dimensional shear wave phase velocity images for the experimental in vivo human liver studies. The f0 used for the calculations was equal to (a) 80, (b) 140, and (c) 200 for all five subjects examined, respectively. Results for LPVI with active bandpass filters introduced in this manuscript are shown. The window size, Wz,x, was equal to 5.17 × 5.17 mm.
