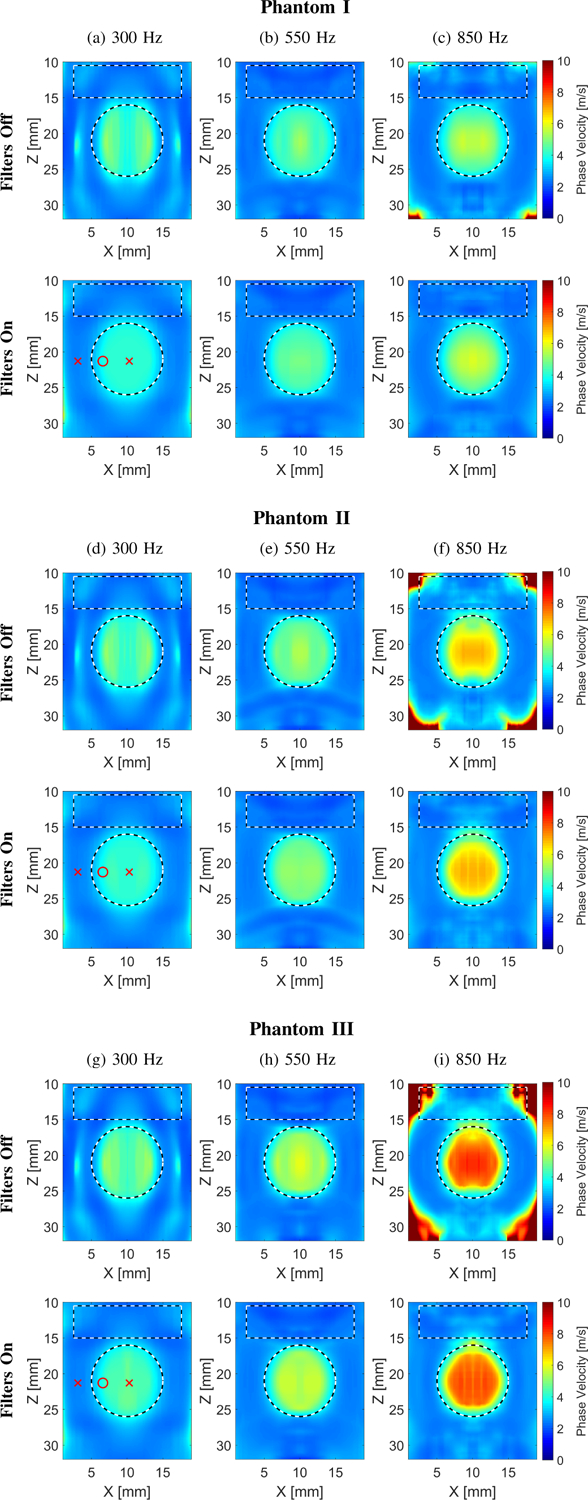
Fig. 5:

Two-dimensional shear wave phase velocity images for the LISA heterogeneous, viscoelastic numerical data. The f0 used for the calculations was equal to (a), (d), (g) 300, (b), (e), (h) 550, and (c), (f), (i) 850 Hz for Phantoms I–III, respectively. Results for LPVI without bandpass filters similar to the work described in [40] are shown in the top row (Filters Off). Results for LPVI with active filters introduced in this manuscript (for a constant bandpass filter set to 0.5–11 m/s) are shown in the bottom row (Filters On). The window size, Wz,x, was equal to 4.0 × 4.0 mm. Red markers in (a), (d) and (g) in the bottom row correspond to positions, for the background and inclusion, for which phase velocity curves in Fig. 7 were plotted.
