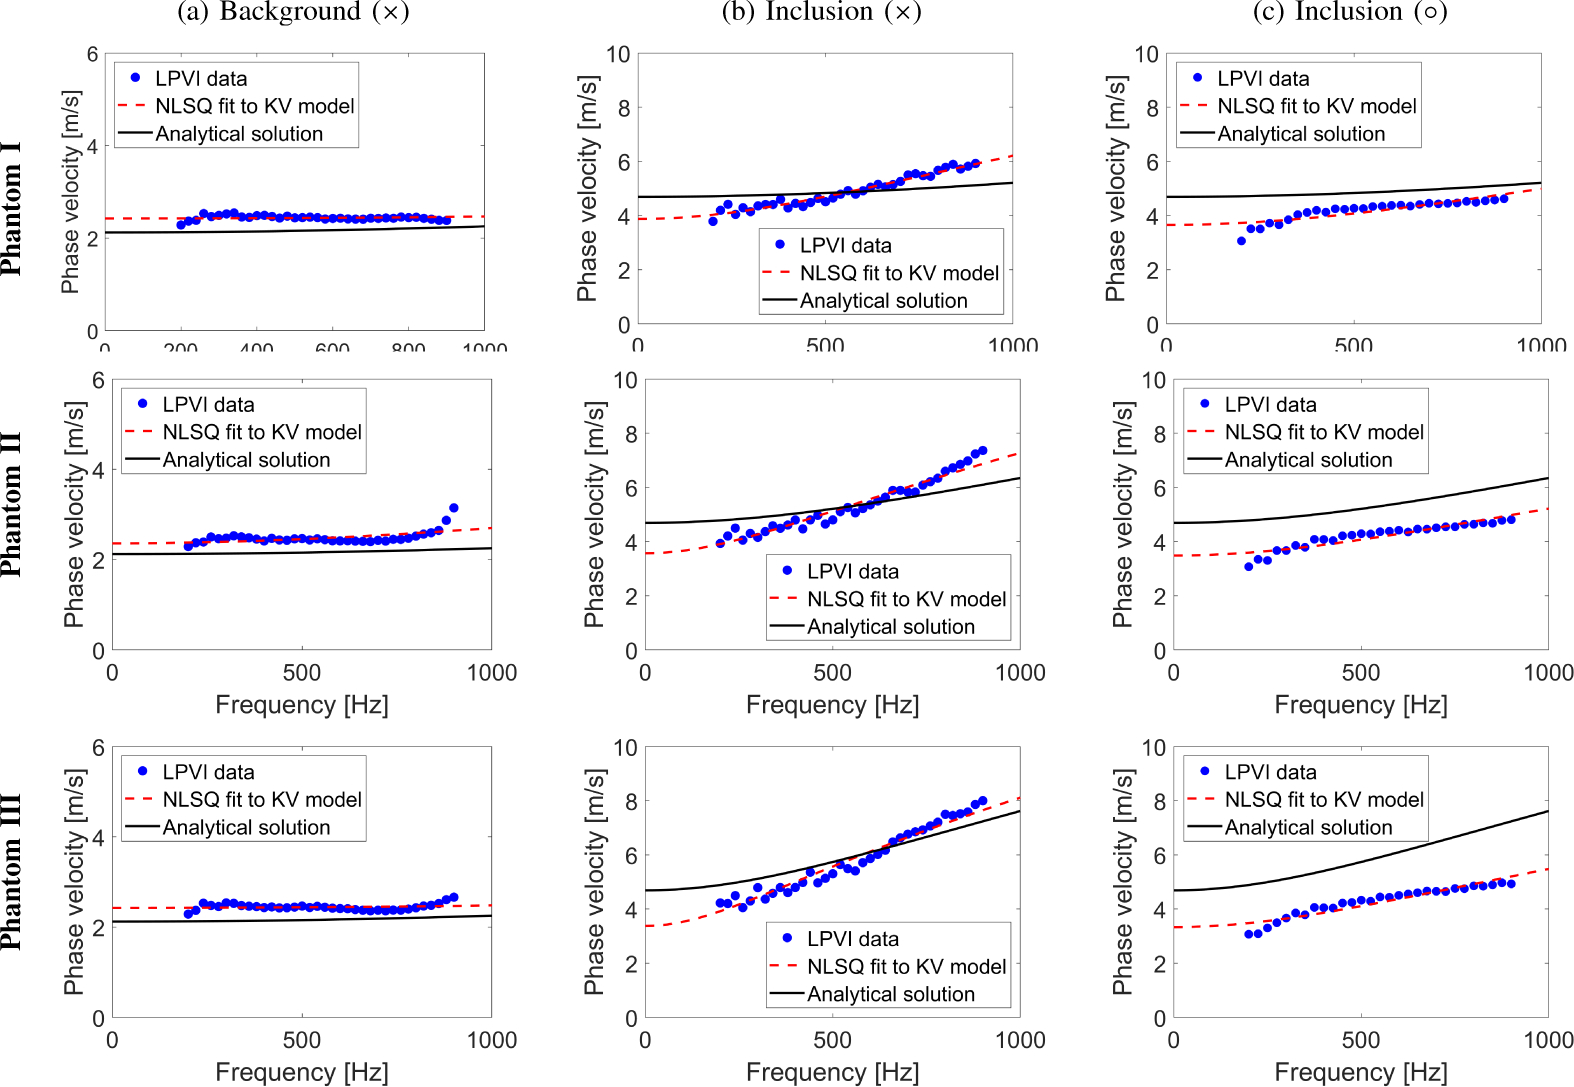
Fig. 7:

Phase velocity dispersion curves calculated for the (a) background, and inclusion locations marked as (b) ×, and (c) ○ in Fig. 5a using red markers. Blue dots correspond to LPVI data. Red, dashed lines represent NLSQ fit to the KV model for LPVI data. Black, continuous lines show theoretical dispersion curves computed using Eq. (11).
