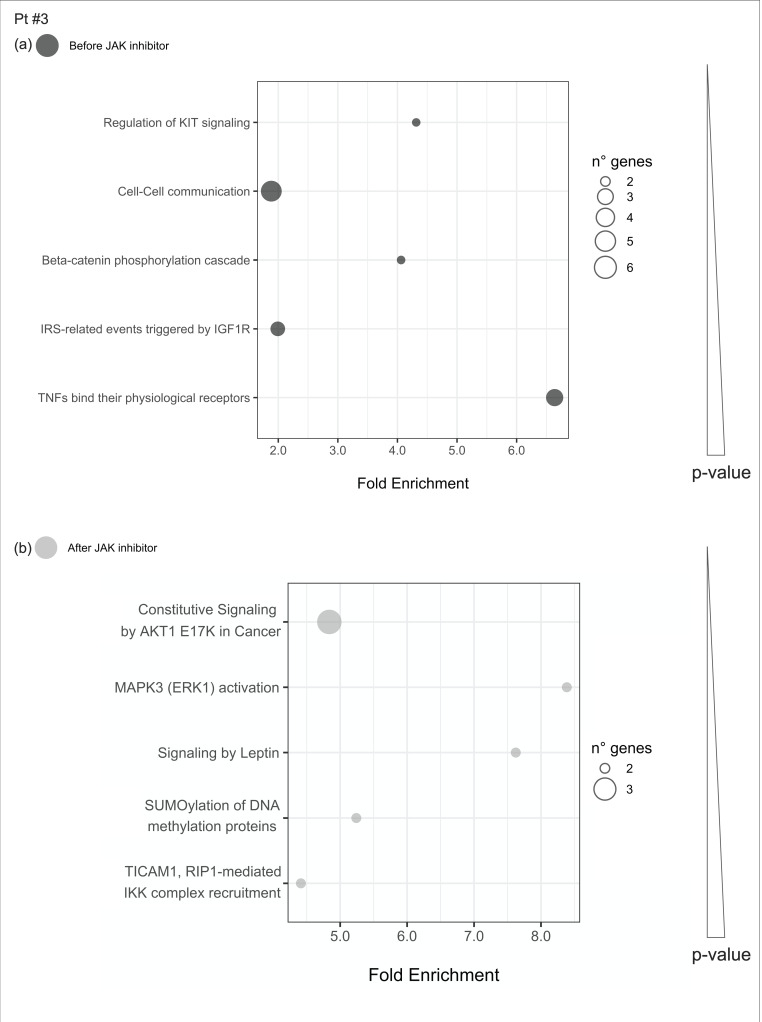
Figure 10.
Pathway enrichment analysis was run on differential expressed genes resulting from the comparison between patient #3 before JAKinhibs and the control-group subjects and between patient #3 after JAKinhibs and the controls. Pathways altered uniquely before (a) or uniquely after (b) JAKinhibs were chosen. Each dot represents a pathway, and the size is directly proportional to the number of genes. On the X-axis is displayed the pathway fold enrichment. All the selected pathways showed a lowest adjusted p-value of the given term over all iterations ≤0.01, and the five most enriched pathways were elected, where applicable. Pathways are ordered by increasing p-values. Pathways altered before JAKinhibs are colored in dark grey and those altered after JAKinhibs in light grey.

