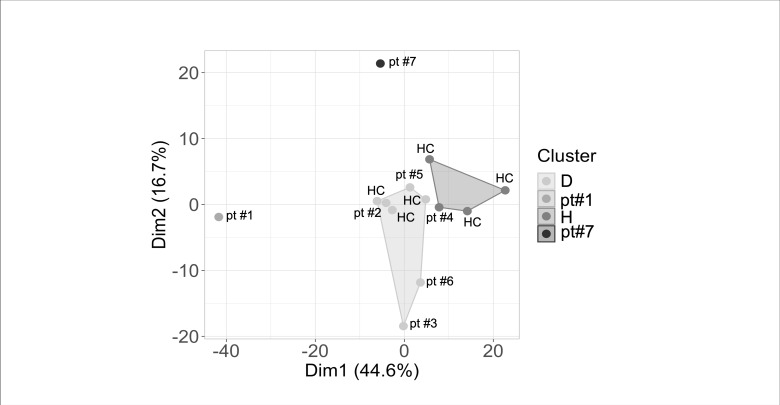
Figure A1.
Cluster analysis of patients (pt) after JAKinhibs treatment and healthy control-group subjects (HC). Cluster analysis results (K-means clustering) considering 500 most variable protein coding genes across all samples that divide subjects into subgroups by similarities. Each dot represents a subject; Dim1 and Dim2 show the higher differences between the main clusters; D-Cluster contains three HC and patients #2, #3, #5, #6. H-Cluster 3: three HC and patient #4. Patient #1 and patient #7 are outliers.

