
Figure 5. Transcriptional reprogramming of DRG neurons after peripheral nerve injury.
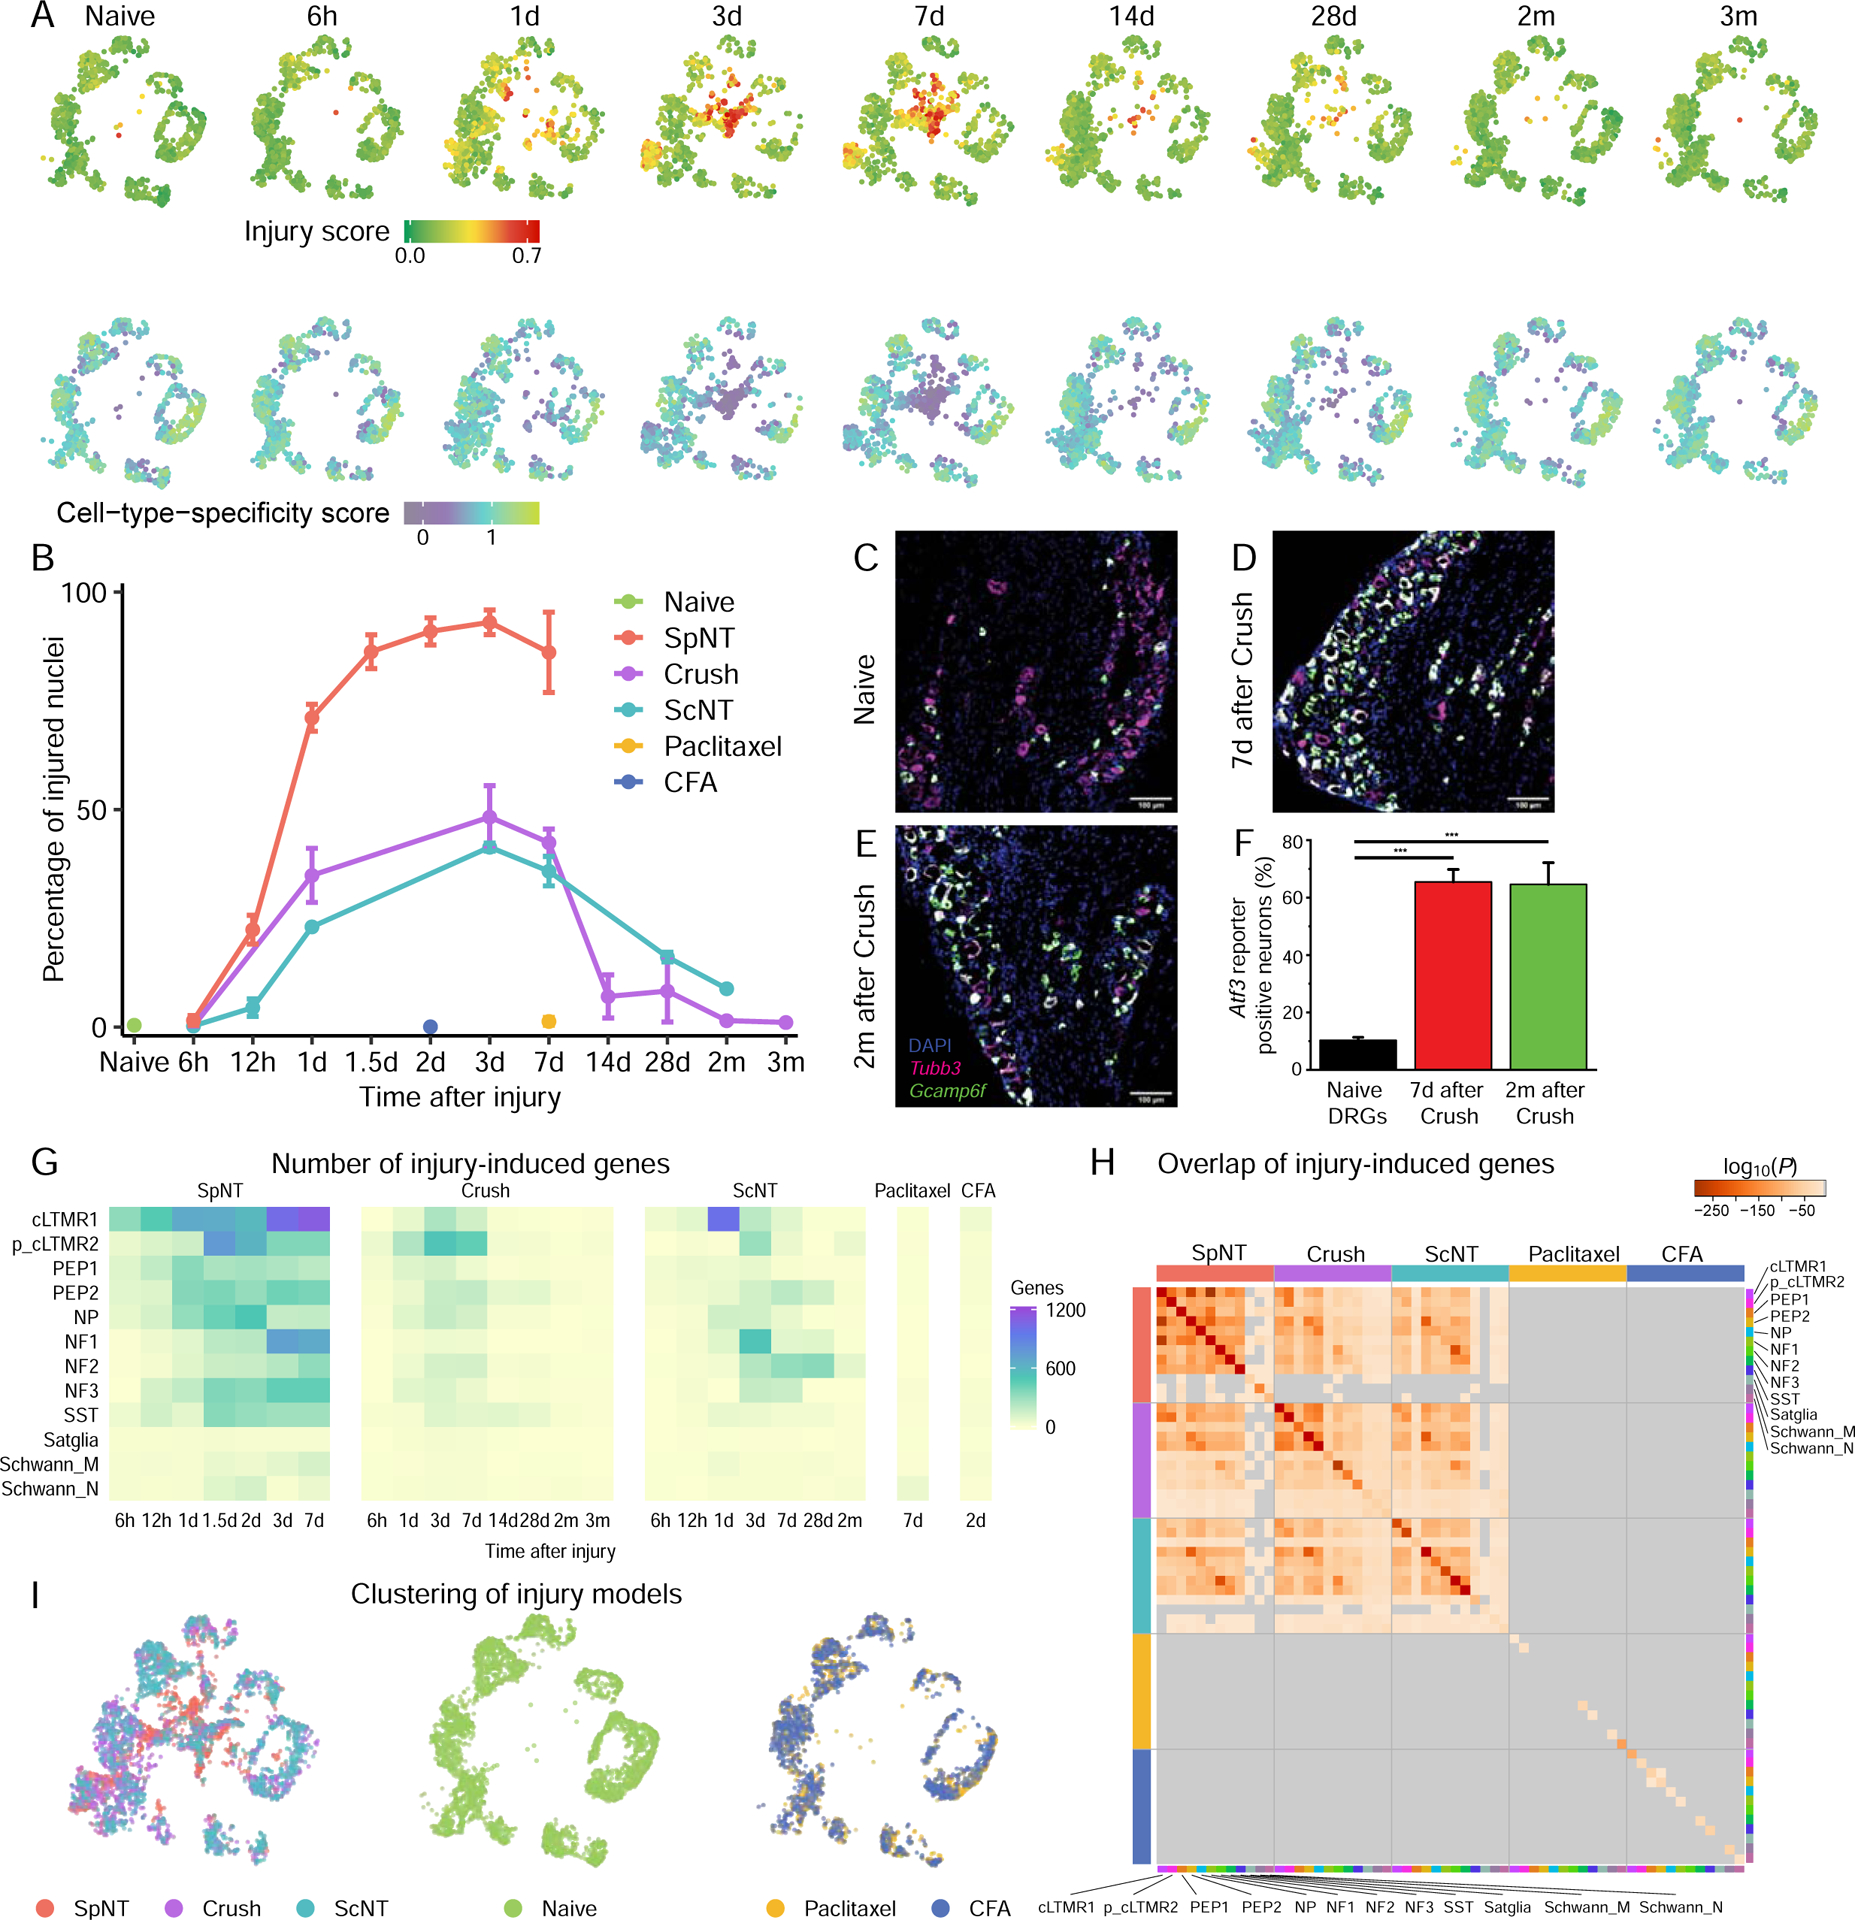
(A) UMAP plots of naive L3–5 DRG neurons or neurons at different times after Crush. Each time point is randomly down-sampled to 1000 neuronal nuclei. Nuclei are colored by injury score (top) or CTS score (bottom), as in Figure 4F. Higher scores indicate greater injury-induced or CTS gene expression.
(B) Percentage of neuronal nuclei classified as injured state at each time point after the respective injury, colored by injury model. SpNT and 6h-7d time points of ScNT are represented from Figure 1E for comparison.
(C-E) FISH images of ipsilateral L4 Atf3-CreERT2;Gcamp6f DRG sections from a naive mouse (C), 7d after Crush (D) and 2mo after Crush (E), stained for Tubb3 (magenta), DAPI (blue) and Gcamp6f (green). The Atf3-driven Gcamp6f reporter is upregulated after Crush and persists for months after injury. Scale bar = 100μm.
(F) Quantification of Gcamp6f reporter gene expression by FISH in L4 Atf3-CreERT2;Gcamp6f naive DRGs or DRGs from mice 7d or 2mo after Crush. N = 3–4 DRG sections from different mice per group, one-way ANOVA, F(2, 8) = 37.4, P = 8.7×10⁻⁵. Crush injury causes an increase in Gcamp6f reporter positive neurons 1w after Crush (Bonferroni post-hoc, P=2.9 × 10⁻⁴), which persists for 2mo after Crush injury (Bonferroni post-hoc, P=1.9 × 10⁻⁴).
(G) Heatmap of the number of significant injury-induced genes for each cell type and time point after SpNT, Crush, ScNT, paclitaxel, or CFA compared to respective cell types in naive mice (FDR<0.01, log2FC>1). The smaller number of gene expression changes in Crush and ScNT compared to SpNT is primarily a consequence of the smaller fraction of axotomized neurons in the distal injury models than SpNT (see Figures S6C–D).
(H) Pair-wise comparison of overlap between injury-induced genes in each cell type 3–7d after SpNT, Crush, ScNT, or paclitaxel or 2d after CFA (FDR<0.01, log2FC>1, compared to naive nuclei of respective cell type). Each square is colored by the P-value for the overlap between each comparison (hypergeometric test); P-values ≥0.05 are gray.
(I) UMAP plots of DRG neuronal nuclei after each injury model, colored by injury model. Left, 3,000 nuclei randomly sampled equally from SpNT, Crush, and ScNT; middle, 3000 nuclei randomly sampled from naive; right, 2,000 nuclei randomly sampled equally from paclitaxel and CFA).