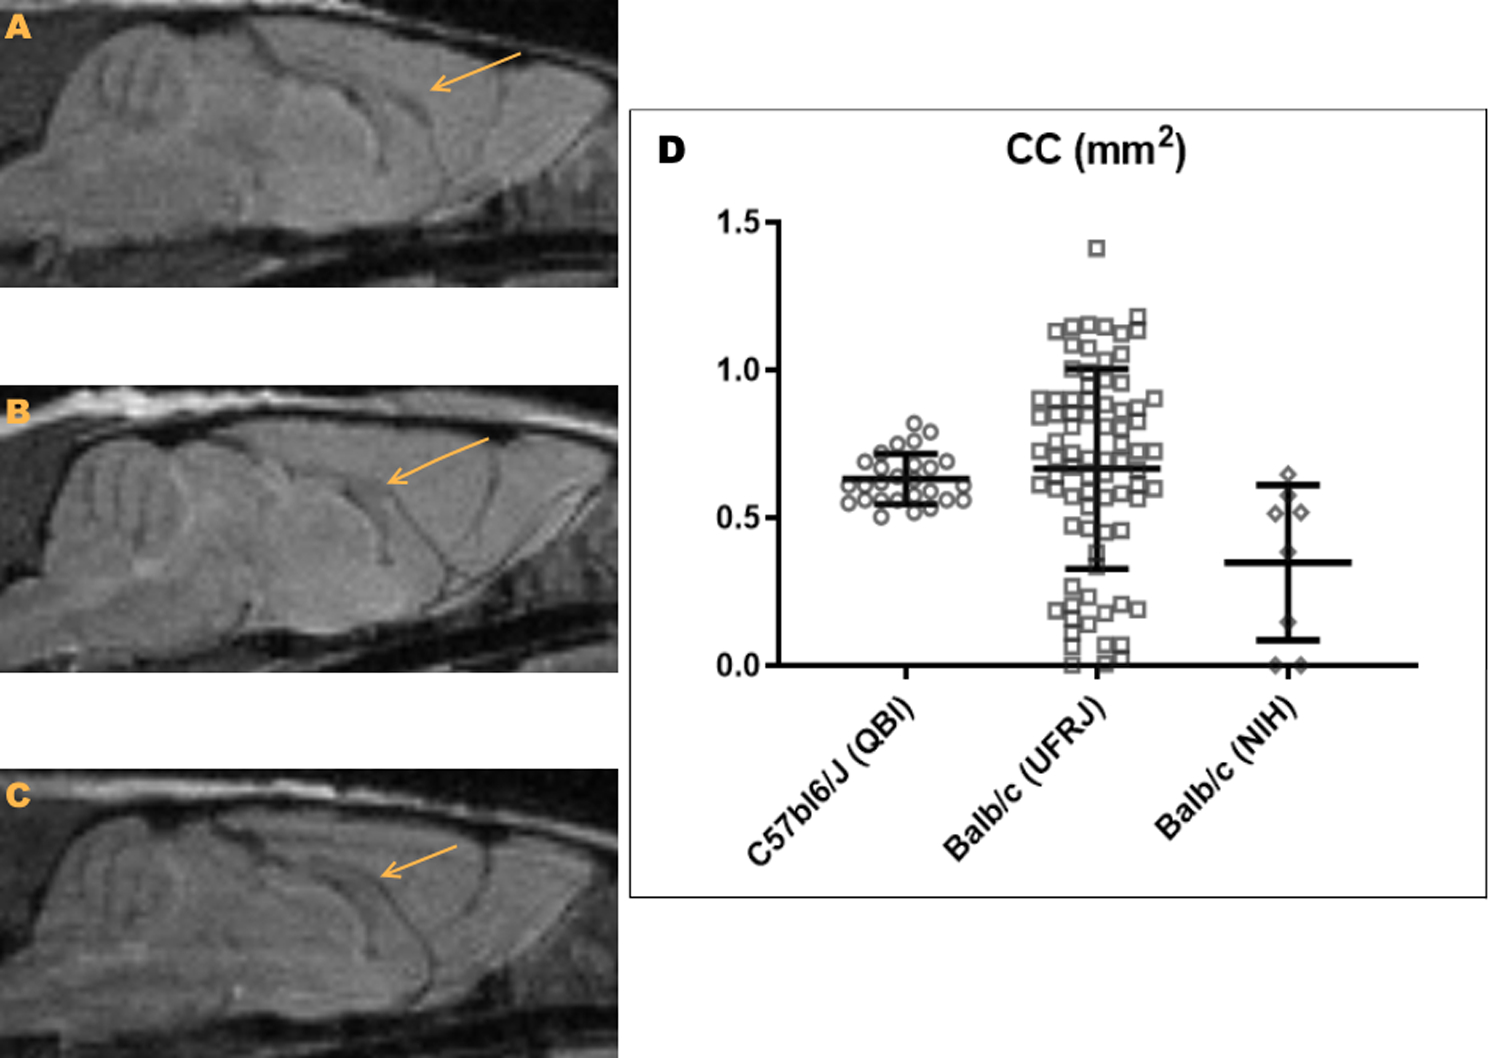
Figure 1. Populational study of CC morphology.

A. Example of a Balb/c mouse with a typical CC. B. Example of a Balb/c mouse with a reduced size CC. C. example of a Balb/c mouse with agenesis of the CC. D. Dispersion graph of the CC area (mm2) in C57bl6/J (from QBI, circles) and Balb/c mice (from UFRJ, squares; from NIH, diamonds). Each dot represents an individual mouse, and bars represent the mean and standard deviation.
