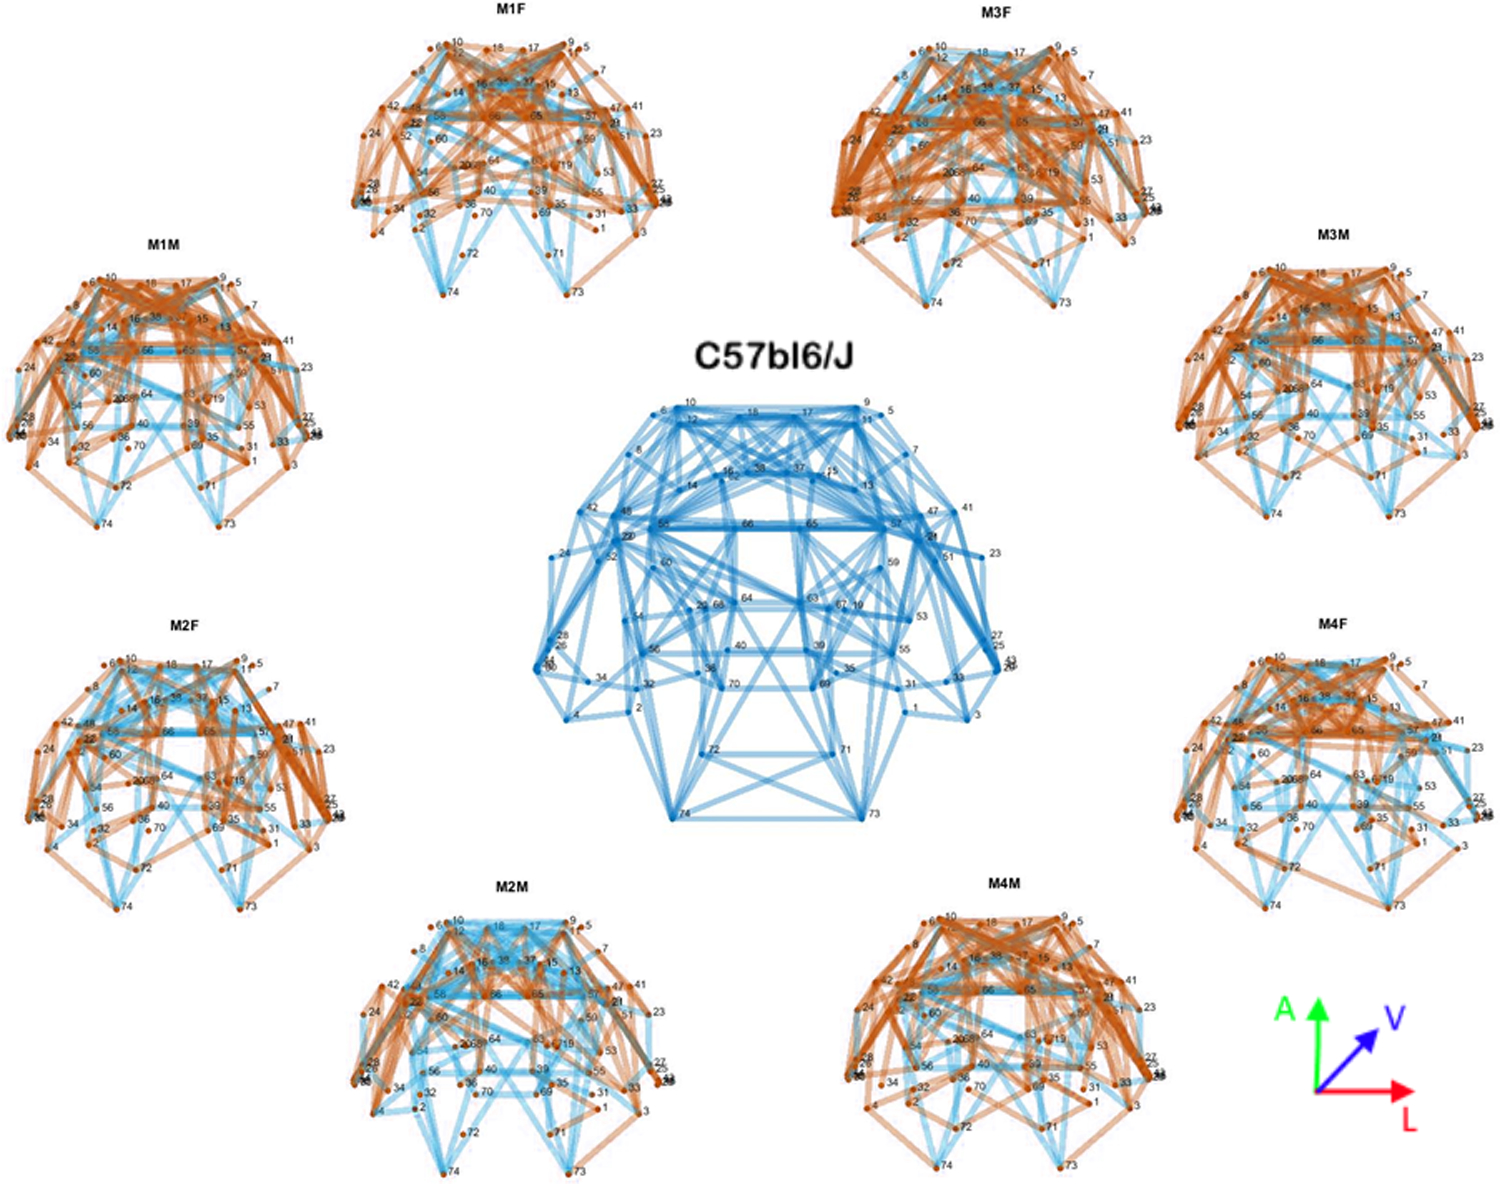
Figure 10. Comparative connectomes.

Graphic representation of the mean binary matrix connectomes. C57bl6/J (center) and each individual Balb/c (periphery). Connections only present in C57bl6/J are in blue, and connections only present in Balb/c are in orange. Common connections are not shown in the graph.
