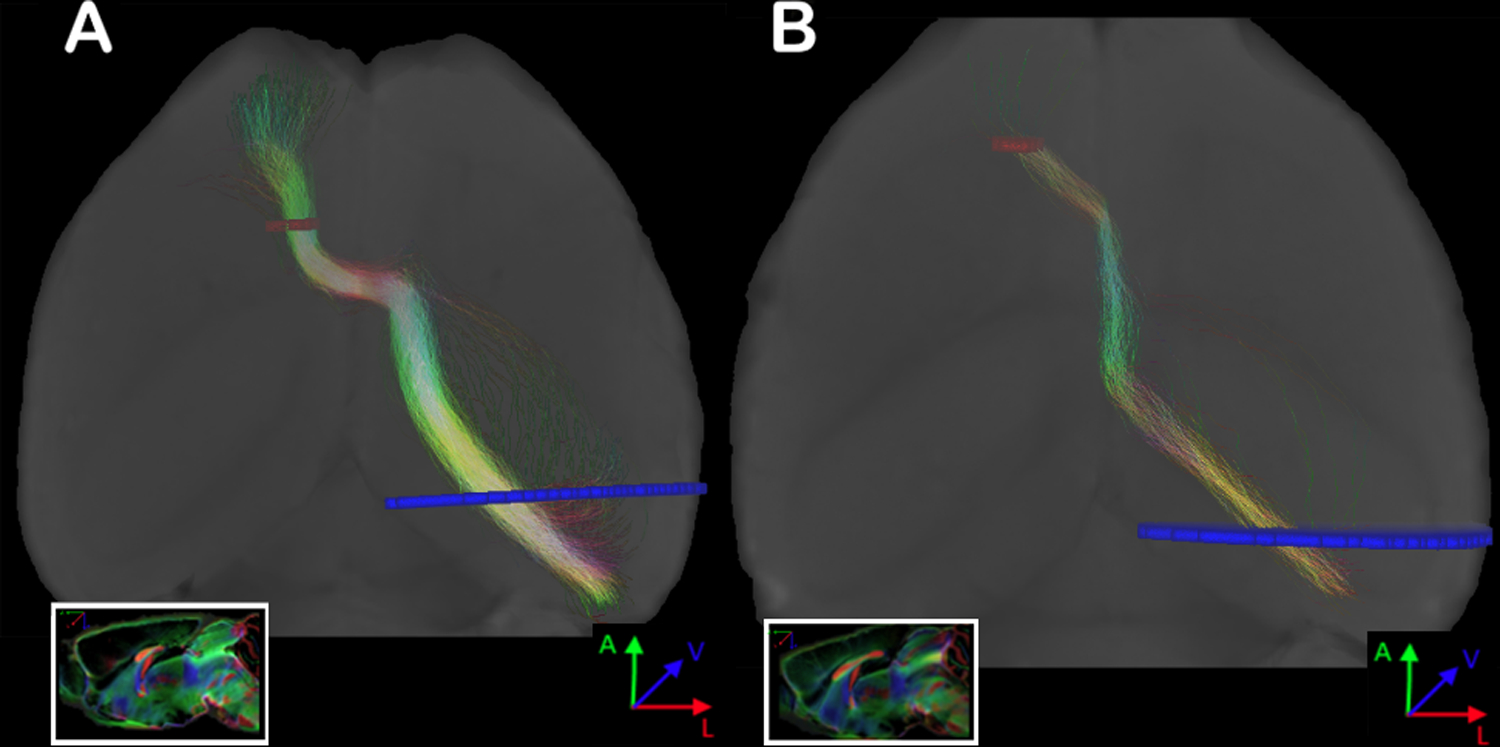
Figure 6. Representative images of two Balb/c animals with Sigmoid bundles.

Probabilistic tractography (A and B, colors are direction encoded), connecting the frontal cortex with the contralateral posterior cortex in the same animal. ROIs were placed in the frontal pole adjacent to the white matter, and a comprehensive ROI was placed in the contralateral hemisphere at the level of the mid hippocampus. Sagittal view in the box. More complete data on these animals with Sigmoid bundles can be found in Supplementary Figure 5. ROIs are shown in red and blue.
