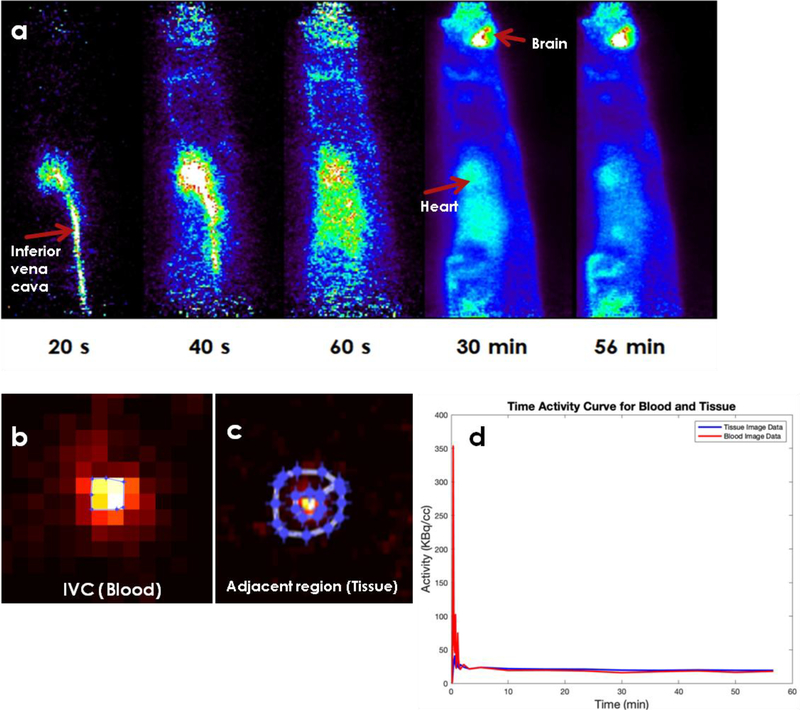
Figure 1: Example time-resolved FDG PET images of IVC in control WKY rats.
a) Time-resolved FDG PET images of the inferior vena cava (IVC) over a period of 60 minutes. The images indicate rapid wash-in and wash-out of FDG from IVC. The arrows point to the inferior vena cava, heart and brain. b) Regions of interest drawn on IVC (zoomed in), c) adjacent region and d) time activity curves for IVC and adjacent region. Computed adjacent region (tissue, t) to IVC (blood, b) spill-in (Stb) contamination using formalism developed earlier (Zhong and Kundu 2013) was negligible (~5%) and hence not included in the computation of Ki.

