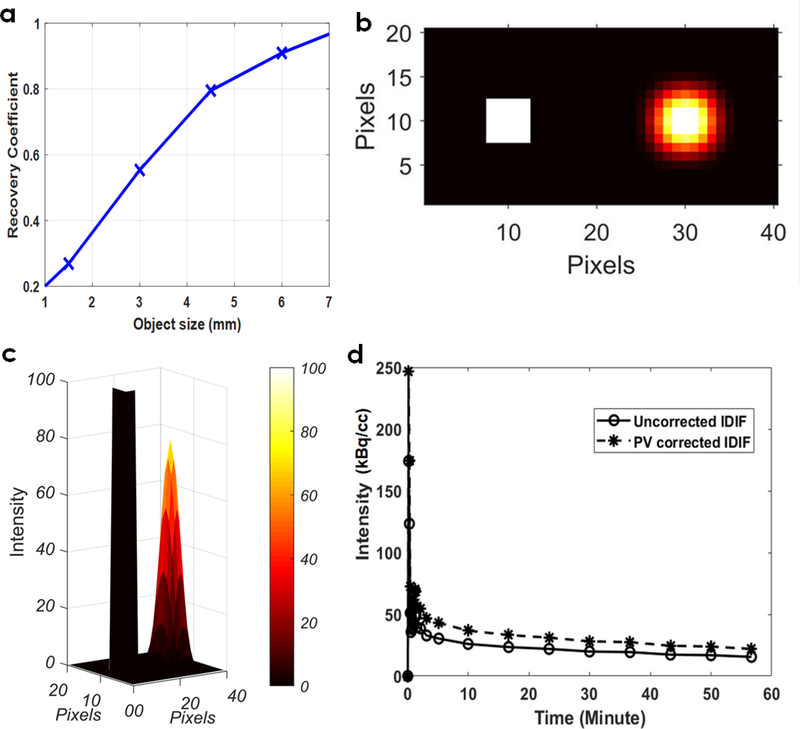
Figure 2: Partial volume corrections on IDIF obtained from IVC.
(a) Recovery coefficient (RC) plot as a function of object size (1–7 mm) obtained by convolution of object size with a Gaussian distribution representing the spatial resolution of the Albira PET system. (b) Representative example 2D plot indicates image of the simulated object (IVC) (left) and that obtained after convolution (right). (c) 3D view of the intensities distributions are shown, indicating a RC of ~70–80% for IVC. (d) Example uncorrected IDIF and PV corrected IDIF for a control WKY rat.

