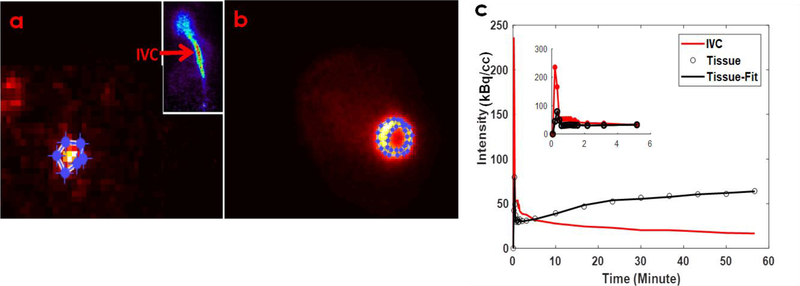
Figure 3: FDG PET images of the IVC, LV and model fit.
Example transverse images of IVC (a) and LV (b) are shown with regions of interest (ROI) drawn and time activity curves (TAC) generated for the ROI’s. (c) PV corrected IDIF from IVC (blood TAC; solid red line) and model fit (solid black line) for tissue TAC (open circles) correcting for SP contamination from the LV blood pool to the myocardium at the early time points and PV recovery of the myocardium in a 5-parameter 3-compartment kinetic model.

