
FIGURE 2.
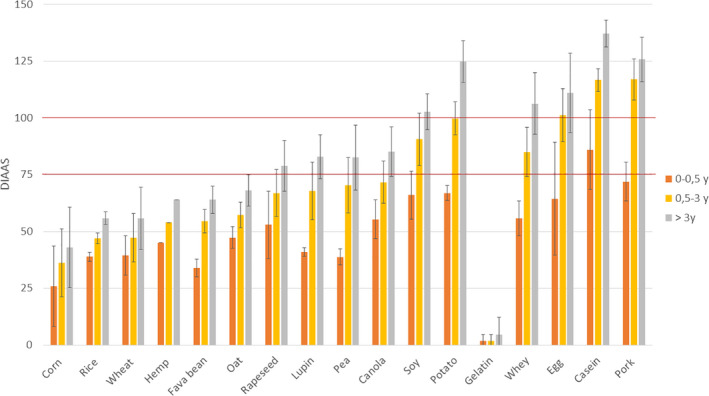
Average DIAAS of various protein sources according to the three reference pattern scores: infant (0–0.5 years), children (0.5–3 years), and children older than 3 years, adolescents, and adults. Error bars represent standard deviation
Official websites use .gov
A
.gov website belongs to an official
government organization in the United States.
Secure .gov websites use HTTPS
A lock (
) or https:// means you've safely
connected to the .gov website. Share sensitive
information only on official, secure websites.
Average DIAAS of various protein sources according to the three reference pattern scores: infant (0–0.5 years), children (0.5–3 years), and children older than 3 years, adolescents, and adults. Error bars represent standard deviation