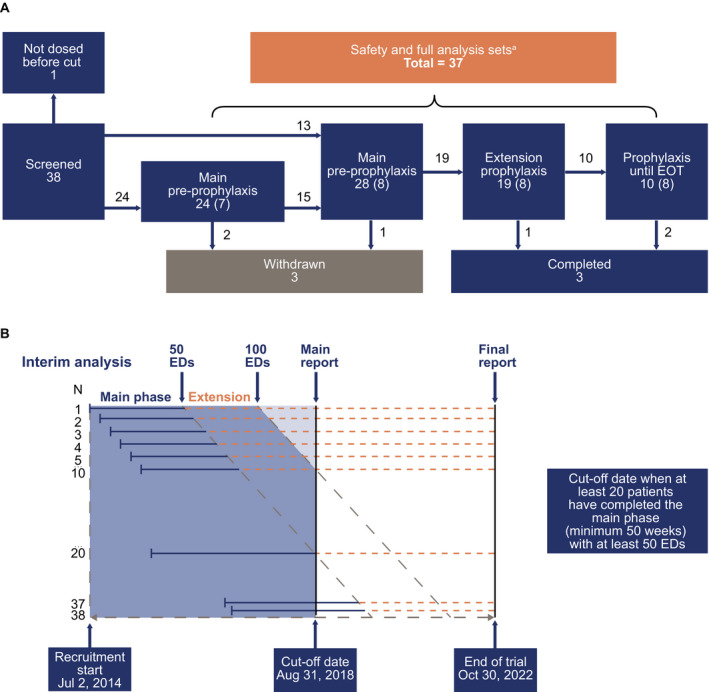
Figure 1.

Patient flow chart showing patient attrition.A, the numbers of patients at various trial stages; B, schema to demonstrate the recruitment timeline. ED, exposure day; EOT, end of trial. aPatients who switched from preprophylaxis to prophylaxis are analyzed in all groups. Numbers in parentheses denote patients ongoing in the trial at time of analysis
