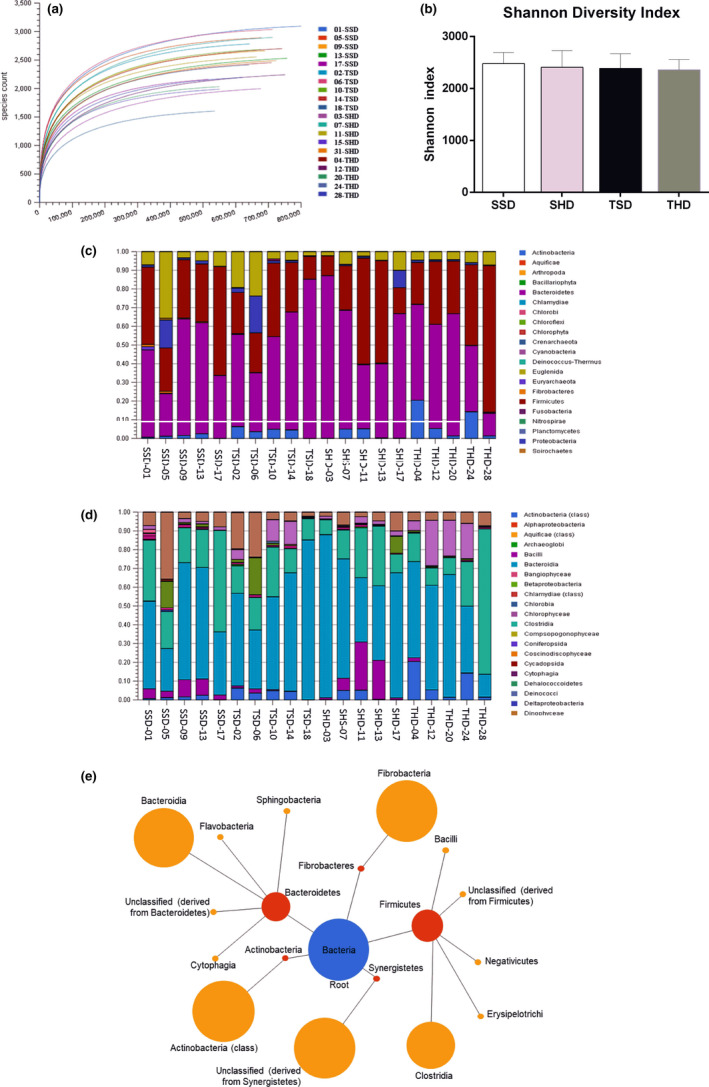
FIGURE 1.

Analysis of fecal microbiome samples of Wistar rats. (a) Rarefaction curves for 16S rDNA sequences. The x‐axis represents the number of sequences generated and the y‐axis represents the richness of species detected. Data generated by MG‐RAST. The correspondence between the curves and samples is shown at the bottom right of the legend. (b) Shannon diversity index. Data tested using a Two‐Way ANOVA Test with Bonferroni's post‐test correction. Data generated by 16S Base Space Illumina App. (c) Fecal microbiota composition among experimental groups at phylum level. Data generated by MG‐RAST. (d) Fecal microbiota composition among experimental groups at class level. Data generated by MG‐RAST. (e) The main bacterial groups identified at phylum and class levels among the experimental groups. The red node represents a phylum and class respectively, and the sizes of the nodes are proportional to the average relative taxonomic abundances. Data generated by MG‐RAST. N: 5 animals per group. SSD, sedentary standard chow diet; TSD, trained standard chow diet; SHD, sedentary high‐sugar diet; THD, trained high‐sugar diet
