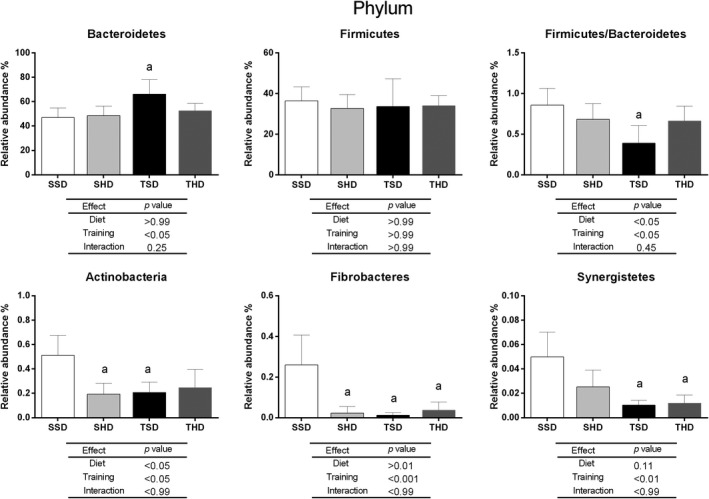
FIGURE 2.

The relative abundance at phylum level of the fecal microbiome of Wistar rats fed by standard chow or high‐sugar diets and submitted or not to swim training. Data are expressed as mean ± standard deviation. Data tested using Two‐Way ANOVA Test with Bonferroni's post‐test correction. p < .005 was considered statistically significant. aDenotes significant difference in comparison to the SSD group. Analyses were performed in the 16S Base Space Illuimna App. N: 5 animals per group. SSD, sedentary standard chow diet; TSD, trained standard chow diet; SHD, sedentary high‐sugar diet; THD, trained high‐sugar diet
