
FIGURE 6.
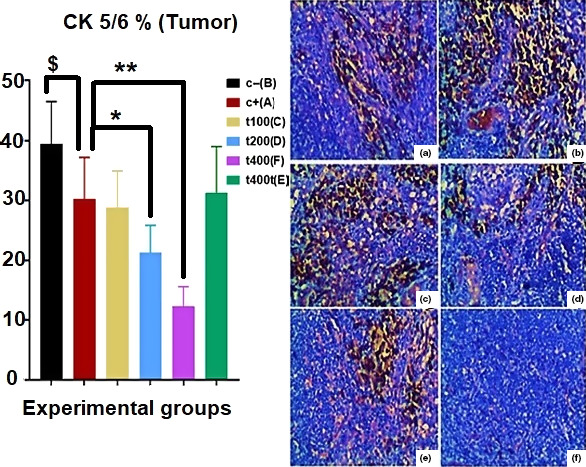
The effect of Trifolium pratense on CK 5/6 expression (CK 5/6‐positive cells) of tumors tissue in positive control (DOX, a), negative control (C−, b), and the extract groups (t100 [c], t200 [d], and t400 [e]) and t400t (f) (mean ± SD). $(p < .05) statistically significant between DOX and negative control groups, *(p < .05) and **(p < .01) statistically significant between treatment and DOX groups