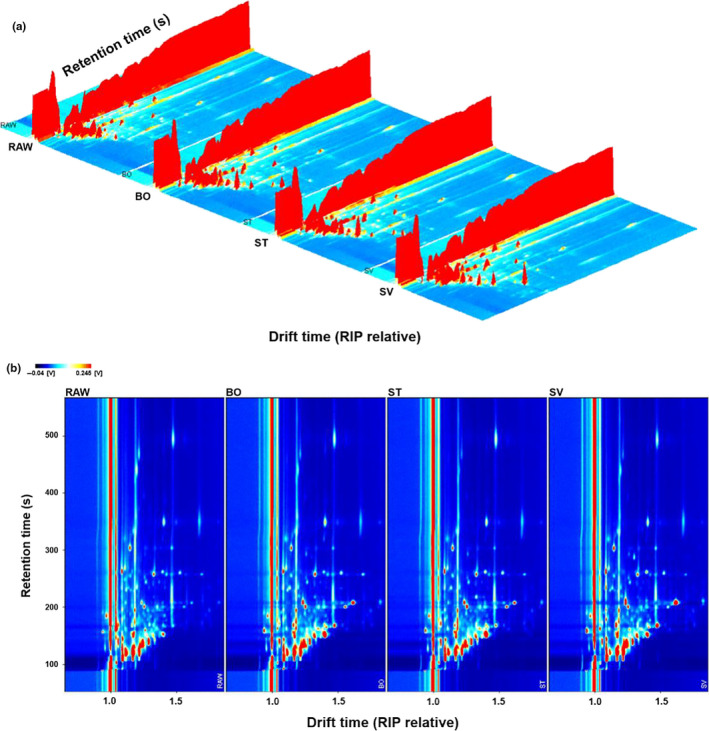
Figure 3.

Gas chromatography–ion mobility spectrometry of squid from different cooking methods. a, Three‐dimensional topographic plots and chromatograms of squid samples. The y‐axis represents the retention time of the gas chromatograph; the x‐axis represents the ion migration time for identification, and the z‐axis represents the peak height for quantification. b, Two‐dimensional topographic plots and chromatograms of squid samples. RAW: raw squid; BO: boiled squid; ST: steamed squid; SV: sous vide cooking squid. The ordinate represents the retention time, and the abscissa represents the migration time. The red vertical line represents the reaction ion peak (RIP), and the migration time after normalization was 8.0 ms. Each point on the right of RIP represents a volatile substance. Color represents the signal intensity of the substance. White indicates low intensity, and red indicates high intensity. The darker the color, the greater the intensity
