
FIGURE 1.
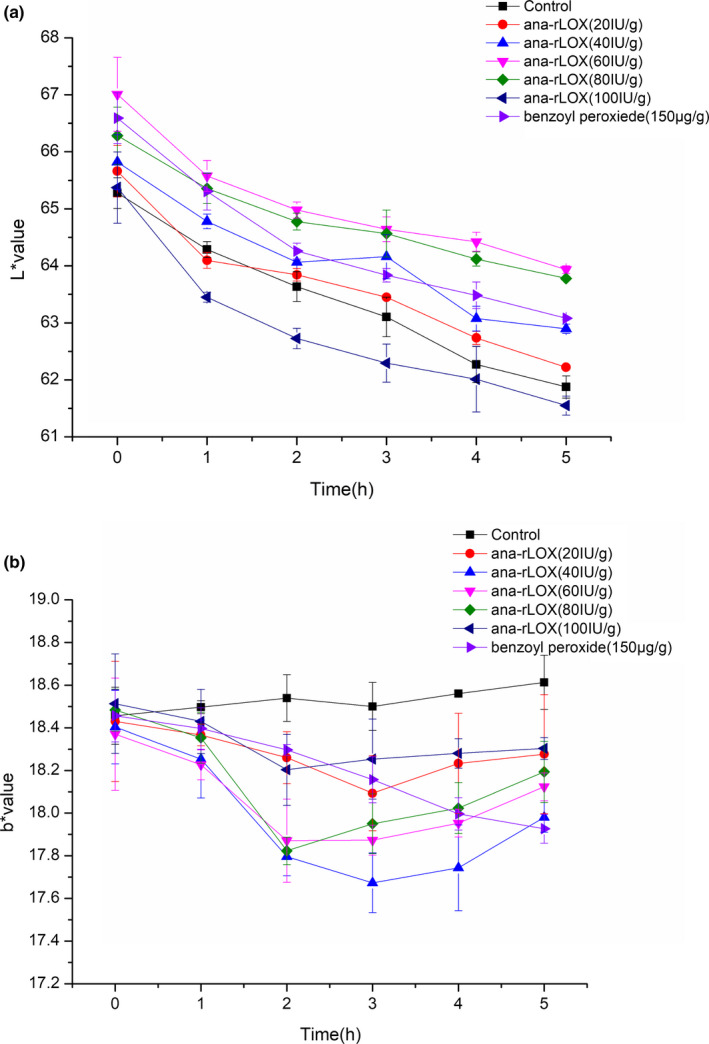
Changes in color components including L* (a), 100 for white, 0 for black) and b* (b),﹢for yellow, ‐ for blue) values of whole wheat dough with different additives at 25°C
Official websites use .gov
A
.gov website belongs to an official
government organization in the United States.
Secure .gov websites use HTTPS
A lock (
) or https:// means you've safely
connected to the .gov website. Share sensitive
information only on official, secure websites.
Changes in color components including L* (a), 100 for white, 0 for black) and b* (b),﹢for yellow, ‐ for blue) values of whole wheat dough with different additives at 25°C