
Figure 2.
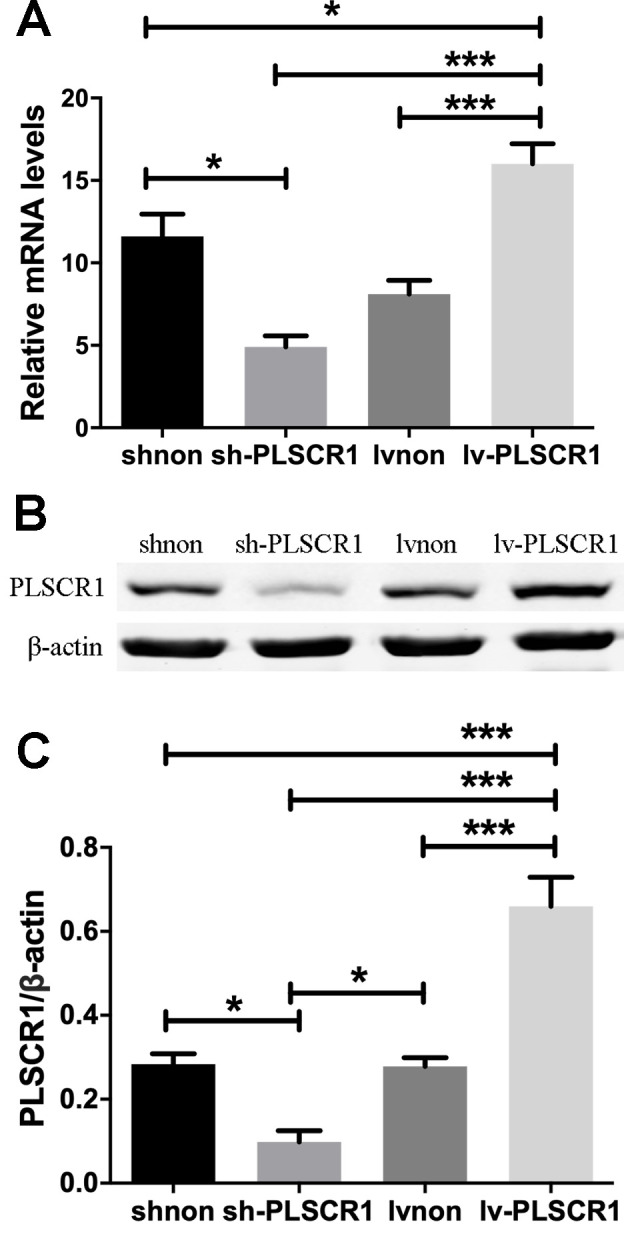
PLSCR1 expression in transfected cancer cells (A) PLSCR1 mRNA expression determined by reverse transcription-quantitative PCR. The results were normalized with β-actin used as the control. (B) Western blotting analyses and (C) quantification for PLSCR1. Quantitative analysis of the bands was performed using LabWorks analysis software. Data are presented as the mean ± SD. *P<0.05, ***P<0.001. lv, lentivirus; PSCR1, phospholipid scramblase 1; sh, short hairpin RNA.