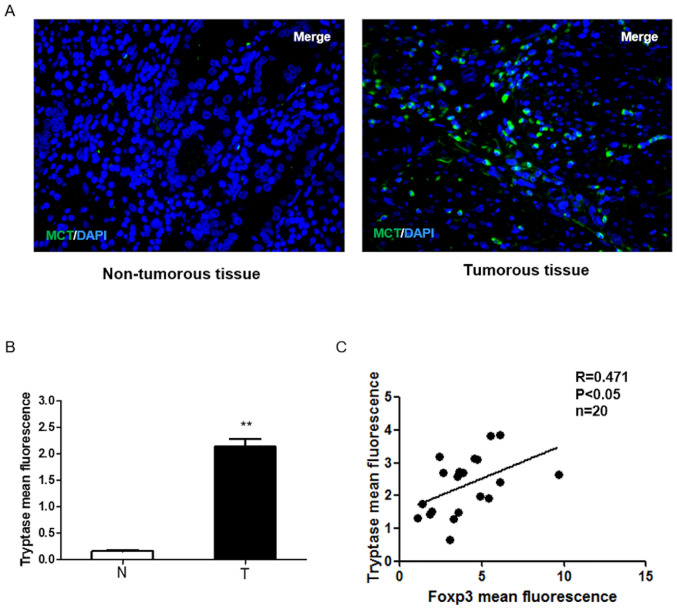
Figure 1.
Role of mast cells in regulating microenvironment immunity of gastric cancer. (A) Immunofluorescence analysis of tryptase (green) expression in a set of 40 human gastric cancer specimens and surrounding non-tumorous tissues (magnification, ×200). (B) Tryptase expression was upregulated in gastric cancer specimens. Mean intensity of Tryptase analyzed by ImageJ software fluorescence was separated into non-tumorous tissue and tumor tissue (**P<0.01 vs. non-tumorous tissue group). (C) Positive correlation between tryptase and Foxp3. Mean intensities of TGFβ1 and tryptase fluorescence were analyzed using ImageJ software. Spearman's rank correlation analysis indicated a significant positive correlation (r=0.471; P<0.05). N, non-tumorous tissue; T, tumor tissue; Foxp3, forkhead box protein 3; MCT, Mast Cell Tryptase.

