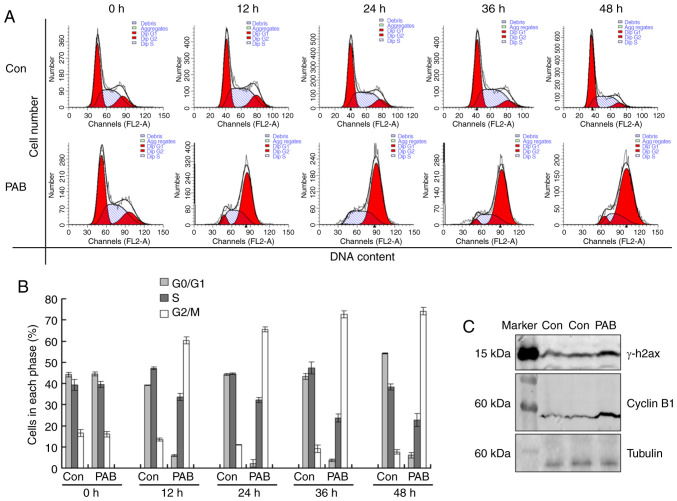
Figure 5.
PAB induces G2/M cell cycle arrest. (A) The cell cycle profiles were determined by flow cytometry at the indicated times with 4 µM PAB. (B) 4 µM PAB induced cell cycle arrest between 0 and 48 h. Data are presented as the mean ± SD; n=3. (C) The expression levels of γ-H2AX and cyclin B1 in RD cells following treatment with 4 µM PAB at 24 h. Images of γ-H2AX, cyclin B1 and tubulin blots were from the same batch of samples, but different gels due to the molecular weights of the proteins. The first lane of two control groups is the 0 h control following PAB treatment, the second lane is the 24 h control following PAB treatment. n=3. PAB, pseudolaric acid B; γ-H2AX, phosphorylated H2A histone family member X.

