Fig. 2.
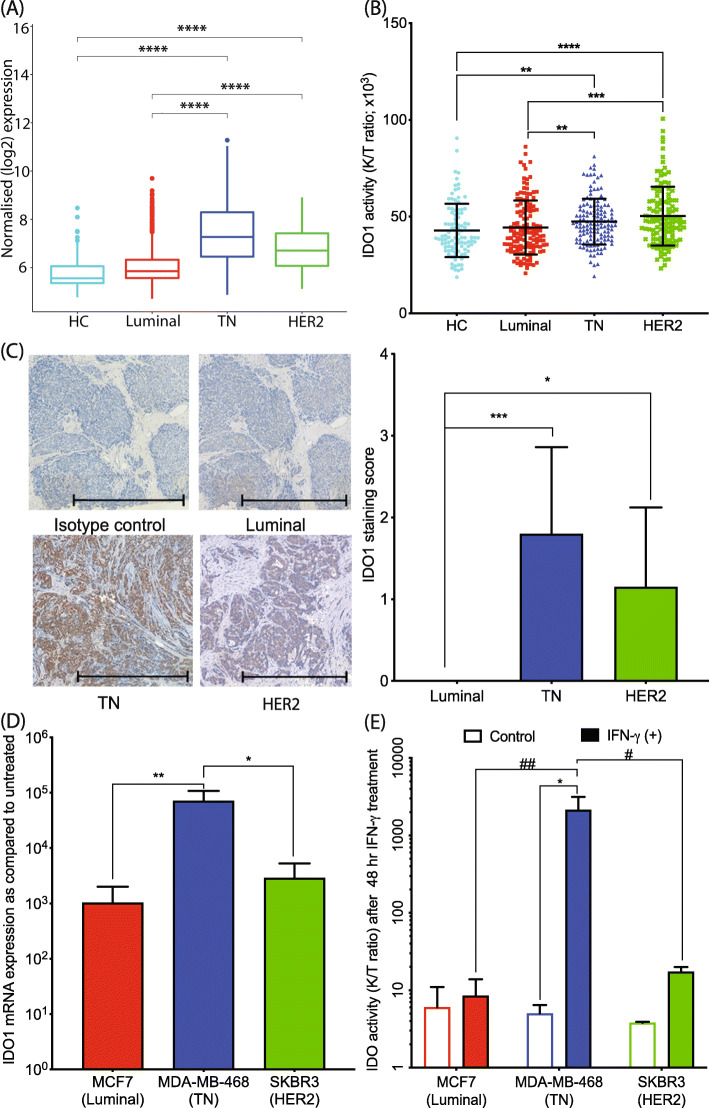
IDO1 enzyme expression and activity in HC and various BrCa subtypes. a IDO1 mRNA log2-normalized expression level is significantly increased in TN (n = 199) and HER2-enriched (n = 220) BrCa subtypes, compared to luminal (n = 1140) and healthy control (n = 144) tissues from the METABRIC dataset. b IDO1 activity (as reflected by the ratio of KYN to TRP concentration, K/T ratio) is upregulated in TN (n = 143) and HER2-enriched (n = 127) BrCa patient serum relative to HC (n = 98) and luminal (n = 138) BrCa patient sera. c IDO1 protein immunohistochemistry in BrCa tissues shows pronounced IDO1 staining in TN and HER2-enriched BrCa subtypes. Representative images of IDO1 staining in BrCa tumor tissue subtypes with semi-quantification (n = 10 each subtype; scale bar, 1000 μM). d Induction of IDO1 mRNA is approximately 100-fold higher in TN cells relative to HER2 and luminal BrCa cells after 24 h IFN-γ treatment (n = 3, in triplicate). e Only TN BrCa cells show a marked translation of active IDO1 protein as judged by K/T ratio after 48 h IFN-γ treatment (n = 3, in triplicate). The error bars indicate the standard deviation from the triplicates of cell culture treatment. KP metabolite analysis was performed using uHPLC. *p < 0.05; **p < 0.01; ***p < 0.001; ****p < 0.0001

