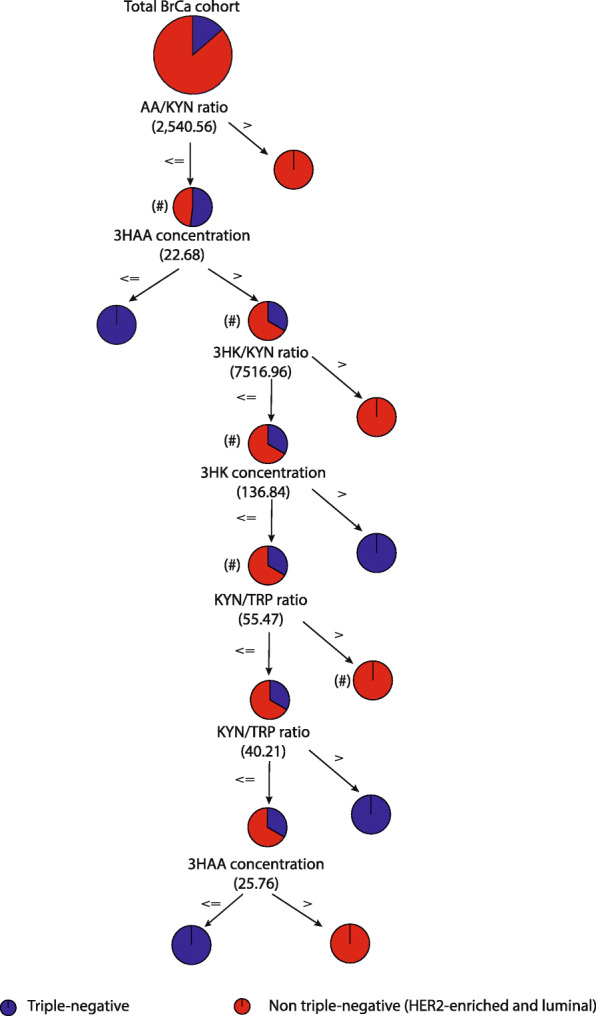
Fig. 6.

Schematic representation of the C 5.0 decision tree that gave the best model to predict TN BrCa patients from other BrCa patients. The schematic flowchart of the C5 decision tree is being used as a classification model to predict BrCa subtypes. The C5 decision tree is applied to discriminate TN cases from non-TN cases (i.e., luminal and HER2-enriched). The predictors used to sort the cases into various groups were 3HAA, AA/KYN ratio, 3HK, K/T ratio, and 3HK/KYN ratio. This was done in a hierarchical order of importance, calculated by the analytical software (data not shown). The purpose of the model is to completely segregate all the TN cases from the non-TN cases using cutoff values from the computed predictors that are iterated by the C5 decision tree algorithm. For example, a BrCa patient with a AA/KYN ratio of less than or equal to 2540.6 (#), a 3HAA concentration was greater than 22.68 nM (#), a 3HK/KYN ratio was less than or equal to 7516.96 (#), a 3HK was less than or equal to 136.84 nM (#), and a K/T ratio greater than 55.47 (#), then the model predicted them to have non-triple-negative cancer with an accuracy of 95.2%
