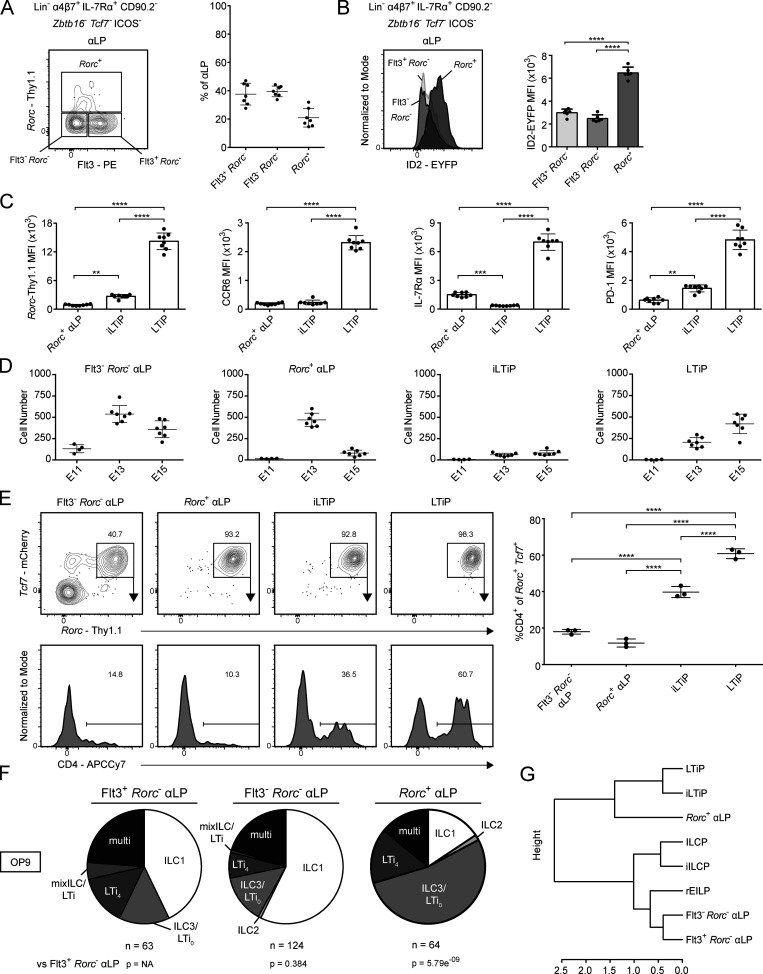
Figure 6.
Identification of Rorc expression in the FL αLP. (A) Representative flow cytometry plot of αLP from Zbtb16EGFPCreTcf7mCherryRorcThy1.1 E15 FL (n = 7). Adjacent plot reflects population frequencies. (B) Representative histogram plot of ID2-EYFP expression in the indicated ILC progenitors from Zbtb16EGFPCreTcf7mCherryRorcThy1.1ID2EYFP E15 FL (n = 6). Associated plots reflect population MFI. (C) MFI of Rorc-Thy1.1, CCR6, IL-7Rα, and PD-1 on Rorc+ αLP, iLTiP, and LTiP from Zbtb16EGFPCreTcf7mCherryRorcThy1.1 E15 FL (n = 8). (D) Quantification of Flt3− Rorc− αLP, Rorc+ αLP, iLTiP, and LTiP from Zbtb16EGFPCreTcf7mCherryRorcThy1.1 FL at E11, E13, and E15. (E) Representative flow plots and histograms of bulk cultured Flt3−Rorc− αLP, Rorc+ αLP, iLTiP, and LTiP from Zbtb16EGFPCreTcf7mCherryRorcThy1.1 E15 FL cultured for 2 d on OP9 stromal cells (n = 3). Adjacent plot reflects CD4+ frequency among Rorc+Tcf7+ cells. (F) Single-cell potential of the indicated αLP precursors sorted from Zbtb16EGFPCreTcf7mCherryRorcThy1.1 E15 FL onto OP9 stromal cells. (G) Hierarchical clustering dendrogram of ILC progenitor clonal potential on OP9 stromal cells calculated from Pearson correlation. For plots, each symbol represents an individual FL; data are presented as mean ± SEM; and P values were determined by one-way ANOVA with Tukey’s multiple comparisons test. P values for pie charts were calculated using Chi-Square Test for Independence followed by post-hoc analysis with Bonferroni correction; comparisons were made against the Flt3+ Rorc− αLP (black). Data are pooled from at least two independent experiments. **, P < 0.01; ***, P < 0.001; ****, P < 0.0001.

