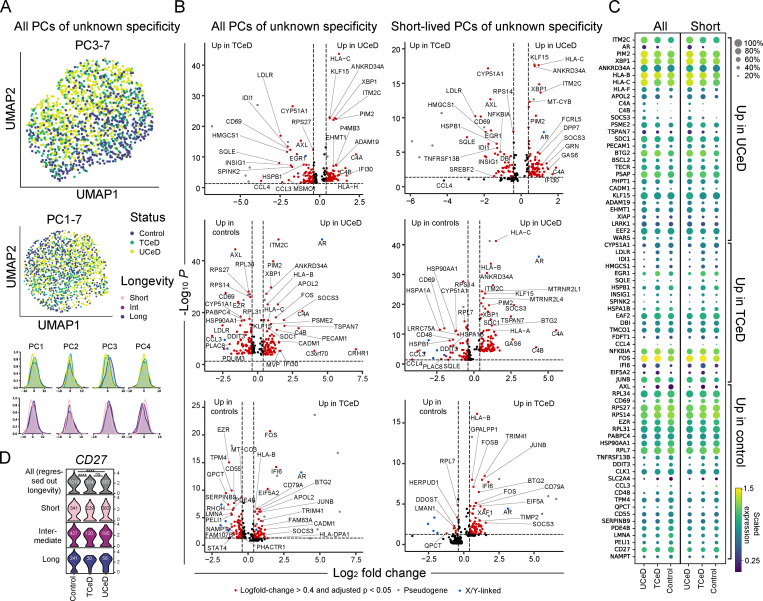
Figure 3.
Transcriptional differences between PCs of unknown specificity in CeD patients and controls. (A) UMAP and individual principal component distributions of all PCs of unknown specificities. PCs of unknown specificity from all UCeD (four patients, 657 cells), TCeD (three patients, 384 cells), and control patients for which we sorted a natural composition of longevities (three patients, 503 cells, sorted as outlined in Fig. S1 C) were sequenced in nine independent libraries in order to perform scRNA-seq analysis. (B) Volcano plots showing DEGs between all (left) and only short-lived (right) PCs of unknown specificity. The analysis of short-lived PCs was done by pooling short-lived PCs from all UCeD (four patients, 383 cells), TCeD (three patients, 229 cells), and all controls (five patients, 341 cells). (C) Mean expression levels of the most highly DEGs of interest between all (left) and short-lived PCs (right) of unknown specificity shown in B. Dot sizes indicate fraction of cells with nonzero expression. (D) Transcription of CD27 in PCs of unknown specificity in UCeD (four subjects), TCeD (three subjects), and controls (five subjects). Effects of different compositions of PC longevities were regressed out (top), or cells of each longevity were plotted separately (bottom). Cell numbers are indicated for each violin plot. P values were calculated with an unpaired Wilcoxon rank-sum test, adjusted for multiple hypothesis testing; ****, P < 0.0001; ns, not significant. No statistically significant differences were found when analyzing each PC longevity separately.

