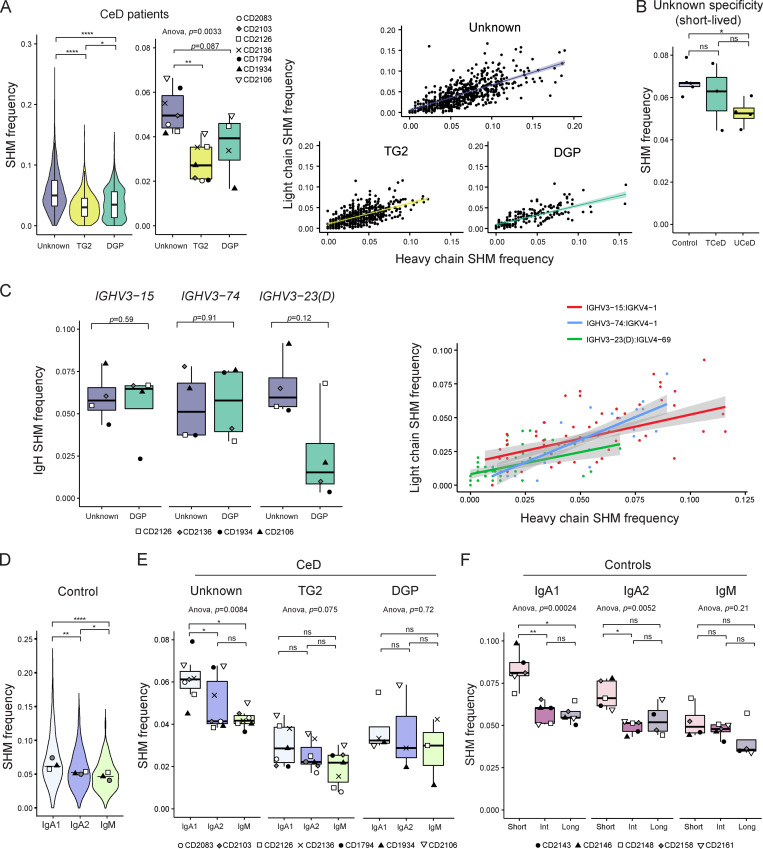
Figure 6.
SHM frequency for PCs according to specificity, disease status, V-gene usage, isotype, and longevity. SHM load in the V-region of BCR sequences reconstructed by BraCeR was calculated with IMGT/HighV-QUEST and normalized by sequence length. Average SHM frequencies for heavy and light chain are shown, unless only one of the chains was reconstructed or otherwise stated. (A) SHM frequency in all BCR sequences from all CeD patients (n = 7) pooled together, stratified by specificity (left). Median SHM frequencies for each patient according to antigen specificity are shown in the central boxplot. P values were calculated with an unpaired Wilcoxon rank-sum test (left) or paired Student’s t test (center). Correlation between heavy and light chain SHM frequencies stratified by PC specificity are shown in the right panel for patients with sorted DGP-specific PCs (n = 4). The colored lines represent fitted trends using linear regression; shades indicate the 95% confidence interval of the fitted line. (B) SHM frequency of short-lived PCs of unknown specificity for all UCeD patients (n = 4), TCeD patients (n = 3), and controls (n = 5). Median values for each individual are shown. P values were calculated with a paired Student’s t test. (C) Heavy chain (IgH) SHM frequency of DGP-specific PCs and PCs of unknown specificity from patients for which DGP-specific PCs were sorted (n = 4), stratified by usage of the three stereotypical IGHV genes used by DGP-specific PCs (left). P values were calculated with a paired Student’s t test. Correlation between heavy and light chain SHM frequencies in the three most common chain pairings among DGP-specific PCs are shown to the right. IGHV3-23 and IGHV3-23D are collectively referred to as IGHV3-23(D). (D) SHM frequency of isotype (sub)classes from controls. Only controls with a natural composition of PC longevities are shown and were pooled together (n = 3). Median values for each individual have been added to the violin plots. P values were calculated with an unpaired Wilcoxon rank-sum test based on the pooled sequences; horizontal lines represent median values based on the pooled sequences. (E) SHM frequency of isotype (sub)classes for each PC specificity in all CeD patients (n = 7). Each data point represents the median SHM frequency for one patient. Only patients with at least three unique BCR sequences in a given group are included. P values were calculated with a paired Student’s t test. (F) SHM frequency of isotype (sub)classes and PC longevities from all controls (n = 5). Only patients with at least three unique BCR sequences in a given group are included. P values were calculated with a paired Student’s t test. Adjusted P values are shown in all figures. *, P < 0.05; **, P < 0.01; ****, P < 0.0001; ns, not significant.

