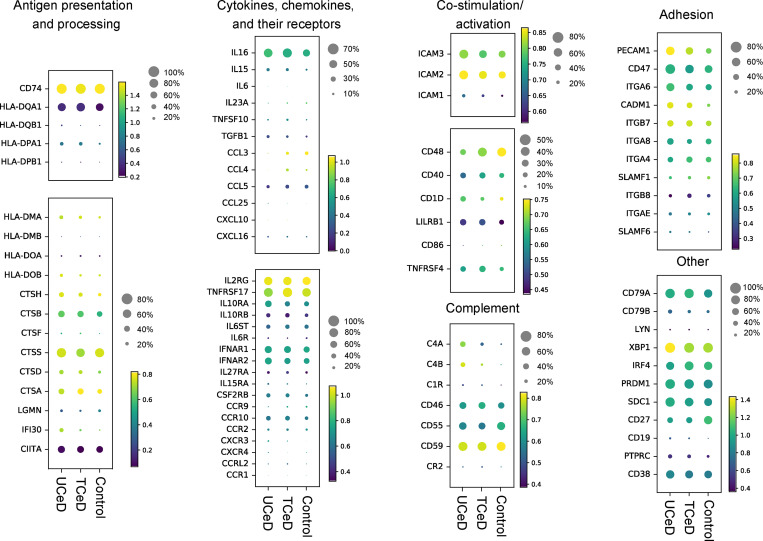
Figure S2.
Transcriptional profiling of intestinal PCs using scRNA-seq. scRNA-seq of PCs from UCeD (n = 4), TCeD (n = 3), and control (n = 5) patients was performed following the Smart-seq2 protocol. After quality control, cells from all individuals, specificities, and longevities were pooled together (Table S3). Scaled expression data of genes of interest are shown in heatmaps according to disease status. Colors represent mean expression of each gene among cells in which the gene was expressed. Dot size represents proportion of cells with nonzero expression of each gene.

