Fig. 6.
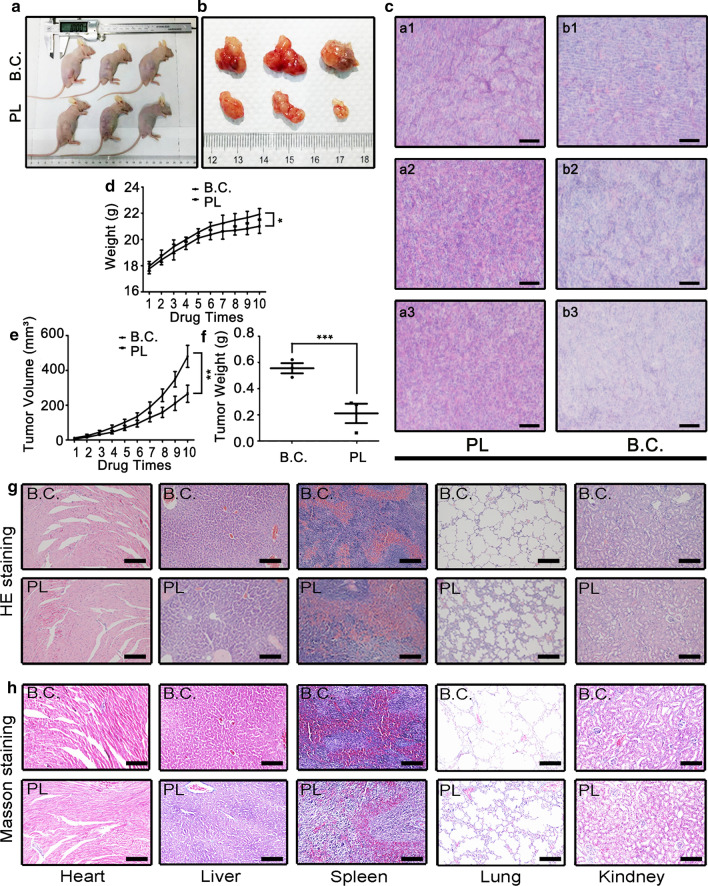
Plumbagin suppressed BCa tumorigenesis in vivo. a, b The photographs of tumor bearing mice and dissected tumor samples, respectively; c The HE staining images of tumor samples, a1-3 and b1-3 corresponding to the three individual animals in the PL group and B.C groups, respectively. Scale Bar: 100 μm; d the growth curves of animal weight during the whole period of drug injection; e the growth curves of tumor volume; f quantitative results of tumor weight; g representative HE staining images of the main organs (heart, liver, spleen, lung and kidney) dissected from the treated mice; h representative Masson staining images of the main organs. Scale Bar: 100 μm. *P < 0.05, **P < 0.01, and ***P < 0.001

