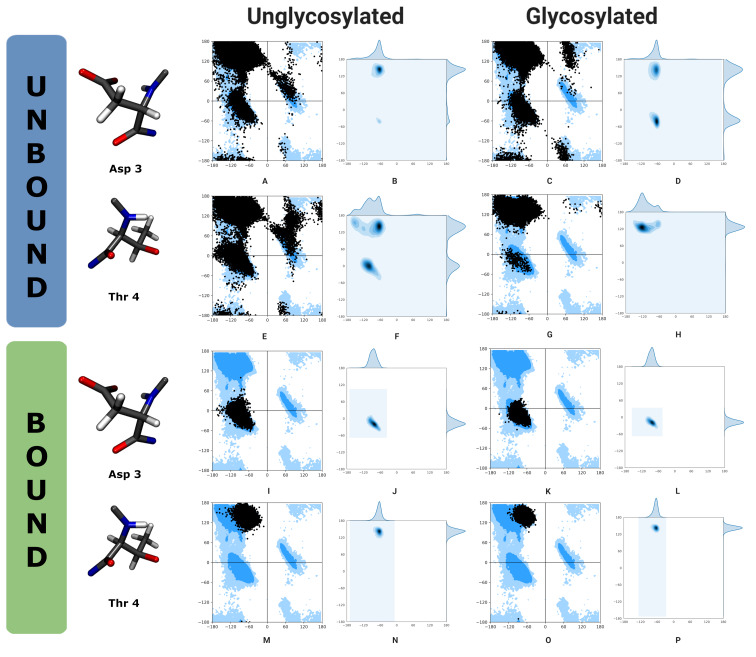
Figure 4.
A comparison of Ramachandran analyses for two key amino acids, Asp3 and Thr4. The first row (A–D) illustrates the φ–ψ angles for amino acid 3 of the peptide, aspartate, with a scatter plot showing the allowed φ–ψ regions highlighted in blue (A), and a probability density Ramachandran plot (B) for the antigen, and a scatter plot (C) and probability density Ramachandran plot (D) for the Tn-antigen. While the second row (E–H) illustrates the φ–ψ angles for amino acid 4 of the peptide, threonine. The left panel of Ramachandran plots are for the antigen, and the right panel are for the Tn-antigen. The first two rows are for the antigens in solution (unbound, A–H), while the final two rows are for the antigens bound to the antibody (I–P).

