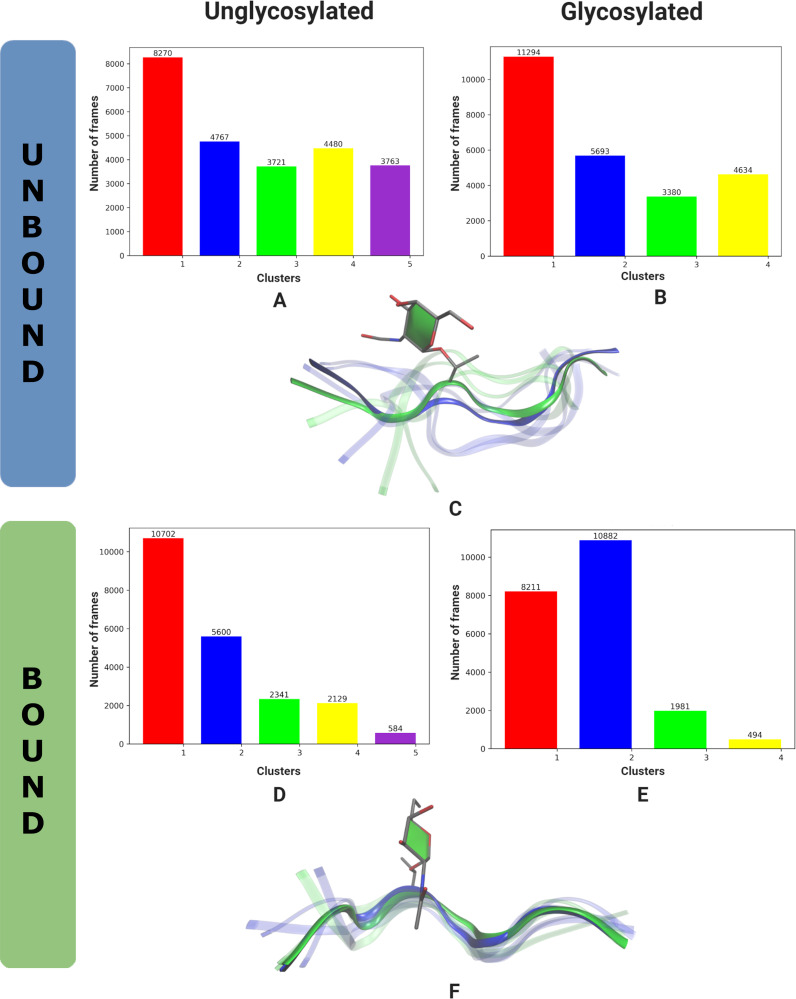
Figure 5.
Distribution of clusters, found using TTClust, for the antigen and Tn-antigen in solution (A, B) and when bound to the antibody (D, E). The conformation of the clusters for solution (C) and bound (F) where the antigen is drawn as a blue ribbon with first cluster conformation in opaque blue. The Tn-antigen is drawn as a green ribbon with first cluster conformation in opaque green. The sugar is drawn without hydrogens in licorice and the sugar ring is highlighted with the paper chain representation [18–19].

