
Figure 7.
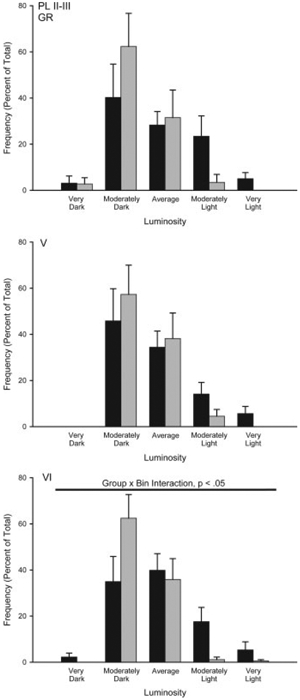
Histograms of the mean number of GR positive neurons (expressed as percent of total) in prelimbic (PL) cortex categorized as having relative luminosities varying from two standard deviations below the mean of controls (darkest) to greater than two standard deviations greater than the mean for controls (lightest) for animals that underwent either standard animal facilities rearing (Control) or maternal separation for 15 min (Separated). For graphic purposes, data have been collapsed into five bins (very dark, greater than 1.5 standard deviations (SD) below the mean; moderately dark, 0.5 to 1.5 SD below the mean; average 60.5 SD from the mean; moderately light, 0.5 to 1.5 SD above the mean; very light, greater than 1.5 SD above the mean). Vertical bars represent SEMs.